BrainVoyager v23.0
What's New
The following sections briefly summarize the major new features of the current and previous releases. For a complete list of new features, enhancements and bug fixes, please consult the release notes. Use the provided links to quickly move to the corresponding documentation.
BrainVoyager 23.0
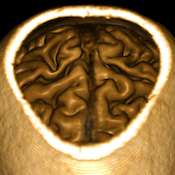
Advanced Volume Renderer
Volume rendering is an important means of complex data visualization complementing surface rendering as implemented in the 3D Viewer. While volume rendering was available in previous versions, this new implementation offers substantially improved render quality, a richer feature set and better integration in the user interface. The Volume Renderer can be called on any VMR dataset directly from the VMR View context menu or from the context menu of the title bar of a VMR document tab. For more details, consult the the new Volume Renderer documentation.
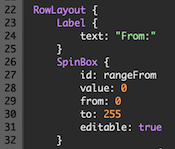
Integrated User Interface Development
A modern, easy-to-learn approach to develop user interfaces for JavaScript scripts as well as C/C++ and Python plugins is now available that is based on the elegant QML language and Qt Quick framework that make it possible to describe user interfaces in an elegant declarative way. Dialogs can be created, tested and run using the new QML / JS Development Window. For more details, consult the Scripts and Plugin chapter.
BrainVoyager 22.4
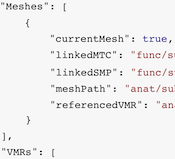
BrainVoyager Scene Files
Scene files (JSON files with extension: '.bvscn') allow to save the state of BrainVoyager's open documents, including also files attached to anatomical volume (VMR) and cortex mesh (SRF) files. When loading a BVSCN file, previously linked datasets including VTC and MTC time course files, VMP and SMP map files, regions-of-interest VO and POI files and fiber tract FBR files will be reloaded and attached to the "hosting" dataset. For more details, consult topic Scene Files in the 'Getting Started' chapter.
BrainVoyager 22.2
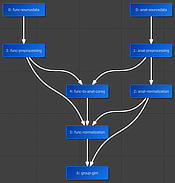
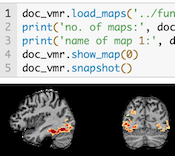
New Data Analysis Manager and Python API
With a few lines of code in a notebook, one can now define reproducible data analysis pipelines, including management of projects and the creation and execution of workflows. Furthermore, rich visual quality reports are generated as self-contained BrainVoyager notebook files that can be inspected after executoin of workflows. This new Python programming interface serves also as the basis of the new Data Analysis Manager, which includes a powerful tool for batch DICOM to NIfTI conversion. For more details, consult the documentation of the new Data Analysis Manager. The underlying Python API is described in more detail in the "BrainVoyager Python Developer Guide".
Inter-Subject Correlation (ISC)
Inter-Subject Correlation uses pairwise correlation to reveal brain regions with activity that is consistently driven across participants (or runs or sessions) without the need of a pre-defined design matrix. ISC experiments often employ complex, naturalistic stimuli such as movies but any task can be used as long as the time course of stimulation is the same across runs. ISC methods are provided both for whole-brain time courses as well as for a provided set of regions-of-interest. For more details, see Inter-Subject Correlation (ISC) Analysis in chapter Functional Connectivity Analysis.
BrainVoyager 22.0
BV Notebooks
The main purpose of BrainVoyager (BV) notebooks is to support reproducible data analysis with rich interactive documents containing code, explanatory text, images and embedded BrainVoyager viewers. BV notebooks not only offer (script) programmers a means to write and document code but they also support non-programmers by converting essential GUI actions automatically into corresponding code. For more details, see chapter BV Notebooks.
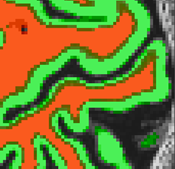
Deep Neural Network Based Segmentation
With recent advances in deep learning (DL), it is now possible to train convolutional neural networks to perform semantic segmentation of 2D and 3D images. This release introduces brain segmentation using a trained deep neural network (DNN) with an advanced 3D patch-wise "Tiramisu" architecture. The trained DNN produces segmentation results that outperform traditional segmentation algorithms enabling the reconstruction of both the inner and outer boundary or the cortex with no or minimal editing. Details about the DNN and how to use it are provided in the Deep Neural Network Segmentation section of the Brain and Cortex Segmentation chapter. Note that using this function requires installation of Python 3.6 and TensorFlow 2.0. Update: Python 3.8 and TensorFlow 2.2 recommended with BrainVoyager 22.2.
BrainVoyager 21.4
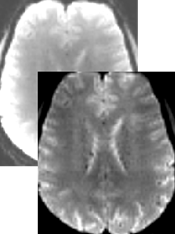
Intensity Innhomogeneity Correction for Functional Volumes
When using some modern phased array coils for MRI scanning, intensity inhomogeneities are not only observed for anatomical data but also for functional data affecting visualization of statistical maps overlaid on functional data. More importantly, inhomogeneities in functional data may reduce the quality of intensity and gradient-driven coregistration of functional and anatomical data (fine-tuning alignment step). This release introduces intensity inhomogeneity correction (IIHC) for functional data volumes operating in the same way as for anatomical data. For details see topic Intensity Inhomogeneity Correction of Functional Volume in the Coregistration chapter.
Creating VOIs from Numerical Region Labels
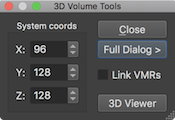
When importing anatomical atlas volumes stored in 1-byte NIfTI (or other) files, intensity values often correspond to numerical labels identifying segregated brain regions (e.g. to store a maximum probability map). Converting such numerical labels one-by-one using the "Define VOI" operation in the 3D Volume Tools is a tedious process. In this release a new Convert VMR Values to VOIs dialog has been introduced that automates this operation. For details see topc VOIs from Numerical Region Labels in the Regions-Of-Interest chapter.
BrainVoyager 21.2
Connectivity and Graph Analysis Tools
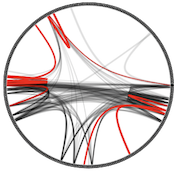
This release introduces a new tool providing brain connectivity analysis using a graph-theoretical approach. The new tool is available as the "Connectivity and Graph Analysis" plugin in the "Plugins" menu. The plugin calculates and visualizes connectivity matrices as well as derived connectivity graphs. The graph analysis tool currently focuses on functional connectivity expecting volume time course (VTC) and volume-of-interest (VOI) files as input. Connectivity matrices can be calculated between voxels of a VOI (voxel-to-voxel) or between a set of VOIs (seed-to-seed) and visualized in a circular plot. Besides visualization of the calculated connectivity, standard graph-theoretical features (e.g segregation, integration, centrality) are calculated and displayed. Further background information and descriptions on how to use the tool can be invoked from the "Connectivity and Graph Analysis" entry in the "Descriptions of Plugins" overview page available from the Plugins menu.
NIfTI Volume Maps
In this release, direct NIfTI support is extended to volume map files that can be loaded and saved directly in the Volume Maps dialog. When exporting VMP data containing multiple maps, each sub-map is exported as a separate NIfTI file. Saving volume maps in normalised (MNI, TAL) space as NIfTI file(s) does not resample the VMP float values, i.e. the maps are stored as 3D arrays without changing the contained values except that the BV coordinate system is converted into the neurological RAS coordinate system involving only value-preserving (90 degree rotations, axis flips) operations. For details, see topic NIfTI Volume Map Files in the Coordinates and Transformations chapter.
BrainVoyager 21.0
New 3D Viewer
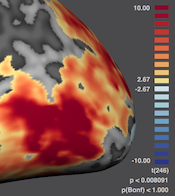
This release introduces a powerful new 3D Viewer with a modern user interface. The new 3D Viewer is based on modern OpenGL, rendering substantially faster than the previous OpenGL implementation and provides more sophisticated and beautiful rendering results. The 3D Viewer also incorporates a modern user interface allowing to manipulate meshes and scenes with floating panels. It also provides a floating color bar using a new diverging color palette as default (also for FMR and VMR maps) that is, from a perceptual point of view, more appropriate to visualize levels of activity than the previously used palette. The color bar (or color disk for pRF angle maps) can be moved freely inside the 3D Viewer to make it easier to make snapshots for figures. For more details about the new 3D Viewer and the new color palette, see topic The 3D Viewer in the Getting Started chapter, topic Overlay Surface Maps in the Statistical Data Analysis chapter, topics Head Skin Reconstruction and Reconstructing Edited Brain Volumes in the Brain and Cortex Segmentation chapter, Drawing POIs in the Useful Tools chapter as well as the Movie Studio chapter.
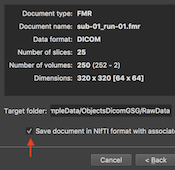
DICOM to NIfTI Conversion
This release continues the process to support NIfTI files as a standard format by adding a Save NIfTI item in the File menu. Furthermore, the Create Document Wizard now provides the option to save created documents in the NIfTI format offering DICOM-to-NIfTI conversion. NIfTI files are also saved when running the "Create Document" workflow in the updated Data Analysis Manager (see below). In addition to a document’s NIfTI file, an additional JSON file is stored with the same name (but with a “.json” file extension) containing metadata about the scanning parameters as well as information entries that are specific to BrainVoyager. For more details about saving DICOMs and BrainVoyager documents as NIfTI files, see topic NIfTI with JSON and TSV Sidecars in the Getting Started chapter and topic Processing NIfTI Files in the Coordinates and Transformations chapter.
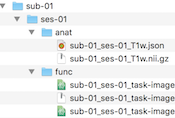
Data Analysis Manager and BIDS Compatibility
The Brain Imaging Data Structure (BIDS) recommendation is becoming a widely used standard in neuroimaging research to simplify data collaboration and data sharing. BIDS describes how to organize neuroimaging (and behavioral) data on disk. This release adds BIDS compatibility to the updated Data Analysis Manager. When creating documents, the Data Analysis Manager now saves created documents as NIfTI files together with sidecar JSON and TSV files using BIDS compatible file names; furthermore, the created document files are organized on disk following the BIDS specification. For details, see topic BIDS Compatibility in the Data Analysis Management chapter.
Content-Focused Dark Interface
This release introduces a dark theme for BrainVoyager's user interface that is consistent across platforms and, thus, especially useful when using BrainVoyager on more than one operating system. Whether used all the time or during low-light situations, the dark theme supports an efficient content-focused working style. The dark interface theme is enabled as default but it can be persistently enabled or disabled using the GUI tab of the Settings dialog. When disabled, BrainVoyager uses the native theme of the respective operating system as in previous versions. For more details, see topic The Graphical User Interface in the Getting Started chapter.
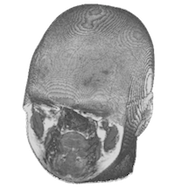
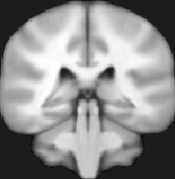
Defacing Anatomical Data
For complete anonymization of MRI data, replacing identity information from (DICOM) files is not enough since the identity of a person can also be recovered from 3D anatomical data. This release adds tools to deface created VMR data sets or even directly the slice images stored in a series of DICOM files using the Deface VMR or Deface DICOM Files items in the File menu. To deface anatomical data, BrainVoyager performs a temporary MNI transformation creating a 12-parameter affine spatial transformation matrix that is applied backwards to a bring a MNI space defacing mask into the data’s original (native) space where it is finally applied. This procedure ensures that no interpolation of the original voxel intensities is introduced, i.e. only the voxels inside the defacing mask are set to 0 while other voxels are untouched. In case of defacing DICOM files, the masked data is saved back - slice by slice - to the original DICOM files. For more details, see topic Anonymization and Defacing in the Getting Started chapter.
BrainVoyager 20.6
Nonparametric Permutation Inference for Multi-Subject Designs
This release introduces the Randomise Plugin that provides reliable nonparametric permutation inference for multi-subject designs. The plugin provides direct support for common multi-subject designs including single-group contrast testing and group comparisions. Other more complex designs can be specified using a flexible graphical user interface. Furthermore, the Randomise Plugin allows to apply the thresold free cluster enhancement (TFCE) method to suppress background noise. The Randomise Plugin uses parallelized code (multi-threading) to achieve reasonable computation times when running on multi-core CPUs. For more details consult the documentation coming with the plugin and the overview in the topic The Multiple Comparisons Problem.
Integrated NIfTI Support
While BrainVoyager offers the "NIfTI-1 converter" plugin to import and export NIfTI files since many years, this version introduces a more integrated approach allowing to open NIfTI-1 files directly from the File menu. Besides convenience, the new routines also better handle conversion to and from BrainVoyagers internal representations so that manual transformation adjustments should no longer be necessary. This version supports direct opening of 3D anatomical (VMR) and 4D functional (FMR-STC VMR-VTC) files in native and normalized MNI or TAL space. The NIfTI transformation matrix is stored in created VMR and FMR headers and will be automatically used when performing FMR-VMR coregistration.
Maximum Probability Maps
Maximum probability maps (MPMs) for POIs and VOIs are useful in case that multiple neighboring probability maps are integrated to label the map with highest calculated probability at voxel or vertex locations. As opposed to "winner" maps, MPMs handle the case when multiple probability maps lead to the same value at a voxel or vertex, which can easily happen when processing multi-subject VOIs and POIs with a small number of subjects. The new MPM functionality solves this issue by inspecting an increasing neighborhood to decide the final label in such tie situations. Furthermore the MPM function automatically creates a new set of non-overlapping VOIs or POIs that can be directly used to summarize and visualize the obtained data as an MPM atlas.
BrainVoyager 20.4
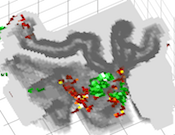
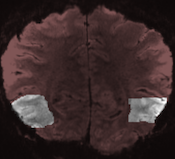
Decoding pRF Models
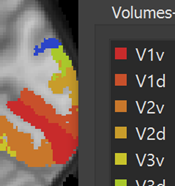
The new pRF decoding tools allow to reconstruct a visual input image from activity patterns in (sub-parts of) visual cortex. The tools can be used to interactively explore fitted pRF models by showing the pRF (location and size) of selected voxels or vertices in visual input space. Furthermore, distributed activity patterns in visual cortex can be decoded in visual input space. This can, for example, be used to reconstruct the visual input shown to a participant from the evoked brain activity. Using ROI masks, it can be controlled which parts of visual cortex (e.g. V1, V1-V3) will be used for decoding.
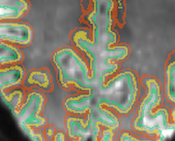
Equi-Volume Cortex Depth Sampling
Cortical layers can now be sampled using an equi-volume approach adjusting the thickness of layers in cortical segments to preserve their volume compensating for cortical folding. Equi-volume sampling better samples layers in brain tissue than the equi-distant modeling approach, especially for anatomical and functional data with very high spatial resolution (hundreds of microns). The equi-volume approach is available both for regional 2D grid sampling as well as for full cortex depth meshes.
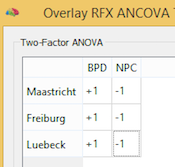
Two-Factor ANOVA
The Two-Factor ANOVA model allows to analyze a dependent variable (e.g. a contrast value per subject at each voxel or vertex) with respect to two-way groupings. The model allows to analyze whether two between-subjects factors interact or whether they exhibit independent main effects on the dependent variable. Besides whole-brain analyses, the two-factor model can also be used ot analyze data extracted from regions-of-interest (VOIs or POIs). Note that the model handles unbalanced designs (i.e. designs with unequal number of subjects in groups) using the Type III sum of squares approach.
BrainVoyager 20.2
Boundary-Based Registration
The new boundary-based registration (BBR) tools provide high-quality coregistration of anatomical and functional data sets (as well as other modalities) of the same subject. BBR uses a reconstructed white matter / grey matter cortex mesh representing the anatomical data. The mesh is "projected" into a functional (or other) data set and spatially transformed in such a way that the vertices are aligned along the the white / grey matter intensity gradient. The approach is suitable, thus, for aligning the anatomy (mesh) with any data set that contains (good) white/gray matter contrast. Because it performs at least as good as other alignment approaches, BBR is available for FMR - VMR (DMR - VMR) fine-tuning alignment and in the FMR-VMR coregistration workflow of the data analysis manager. It is especailly useful for coregistration of high-resolution functional data in FMR-VTC space. Furthermore, it can also be used to optimize the creation of mesh time courses.
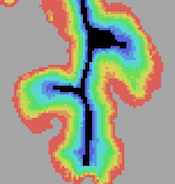
Advanced Volume Rendering for High-Resolution Data
The new advanced volume renderer is especially well suited for high-resolution data allowing to render (functional) map data inside transparently rendered grey matter while keeping white matter opaque. This provides useful insights how functional data extends both tangentially as well as in depth along folded cortex. The advanced volume renderer also allows to visualize "flattened" volume representations of cortical depth grids, which are constructed by stacking 2D grids on top of each other to create standard volume (VMR) data sets together with functional map (VMP) data sampled at different cortical depth levels.
BrainVoyager 20.0
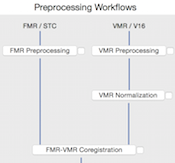
Data Analysis Management, Workflow and Reporting Tools
The new data analysis management tools provide a new way for handling and working with large data sets: Instead of isolated documents, data is entered and managed in a hierarchical manner. At the top level, projects are created by specifying a name and optional entries such as a descriptive text. Under each project, subjects and workflows are added. Under each subject of a project, created data sets are added with information such as the session during which it was recorded. Besides subjects, each experiment also defines workflows that process input data creating desired output data. Since these workflows know about the data belonging to a project, processing can be performed in the same way for all available subjects constituting a powerful batch processing mechanism without the need to write scripts. Furthermore, workfows create detailed reports in HTML and PDF format as a basis for quality assurance and documentaion of performed analysis steps.
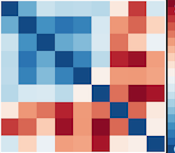
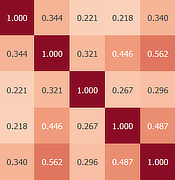
Representational Similarity Analysis
Representational similarity analysis (RSA) allows to analyze the response similarity between evoked fMRI responses in selected regions-of-interest (ROIs). For each ROI a representational distance (or dissimilarity) matrix (RDM) is computed and graphically displayed containing distance measures between pairs of distributed activity patterns representing different experimental conditions. The distance information stored in a RDM is visualized using multi-dimensional scaling (MDS). The calculated similarity structure between conditions can itself be compared with the RDMs from other ROIs by calculating second-level RDMs. Since the comparison of first-level RDMs does not require voxel-level correspondence, data from other sources can be easily integrated at the second-level analysis, including RDMs from multiple subjects, other measurement modalities and computational models.
MNI Normalization
Anatomical and functional data sets can be normalized to MNI space using automatic template-based alignment. MNI space normalization can be selected as an alternative to Talairach space normaliztion for individual VMR dcouments as well as for normalization workflows in the context of the new data management analysis tools. The VTC creation dialog has been updated to allow specifying 12 parameter MNI transformation files to create functional VTC data in MNI space. Template-based alignment can also be used as a robust automatic Talairach transformation tool.
High-Resolution VTC-VTC Alignment
When scanning sub-millimeter functional data to measure columnar-like features or to separate responses (roughly) from differet cortical layers, only a small slab of the brain is usually measured. In order to perform optimal across-run alignment, a VTC-VTC grid search tool has been introduced that explores transformation parameters in a specified range and selects those parameters that produce the best across-run alignment as measured by a goodness-of-fit value that calculates the spatial correlation between the transformed source VTC and target VTC volume. Furthermore, the region of interest within the slab can be masked - the alignment will then be focused to the most critical region in the slab and noisy data (such as infolds and distortions) outside the interesting region will be ignored.
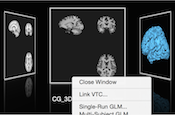
Open Documents Panel
The main window provides a new "Open Documents" panel that is always available via a toggle icon in the main toolbar. The panel provides a graphical overview of available (open) documents presented in a "cover flow" layout. The Open Docs panel is especially useful when many documents are open since it allows to select a document using its current visual representation. It is also possible to quickly browse through the documents and to select a document. Furthermore, a right (context) click on the central (current) document provides a context menu (like for tabs) that can be used to call relevant document-specific functionality.
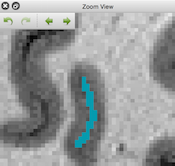
Zoom View Panel
The main window provides a new "Zoom View" panel that is always available via a toggle icon in the top toolbar. Using a mouse selection while holding down the ALT key, any rectangular section of the current FMR or VMR document can be selected to be displayed in the Zoom View panel. This is especially useful for inspecting spatial details of the anatomy and overlaid functional maps from high-resolution (sub-millimeter) scans. For VMR documents, the panel also allows to draw inside the volume using the zoomed section as a proxy to the data. For each open VMR document, the program also keeps a full drawing history allowing undo/redo operations for manual segmentation operations. The zomming rectangle can also be moved to new locations by using mouse dragging while holding down the ALT key.
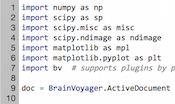
Python for Scripting and Plugin Development
In this version, experimental support for Python is provided (for Mac and Windows 64-bit) with the goal to provide an easy and unified alternative to both standard JavaScript scripting and C++ plugin development. The core of the new tools forms an embedded Python interpreter (based on PythonQt, see http://www.mevis.de). Since the Python interpreter is enriched with access to the Qt API, it is easy to add cross-platform user interfaces for scripts and plugins in Python. The interpreter also has full access to the BrainVoyager scripting API enabling efficient batch programming. Since Python supports powerful modules for scientific computing such as NumPy and SciPy, the same language can also be used to extend BrainVoyager's computational capabilities.
New features introduced in older versions can be found here.
Copyright © 2023 Rainer Goebel. All rights reserved.