BrainVoyager v23.0
Volume Rendering of Anatomical Data
The Volume Renderer Window
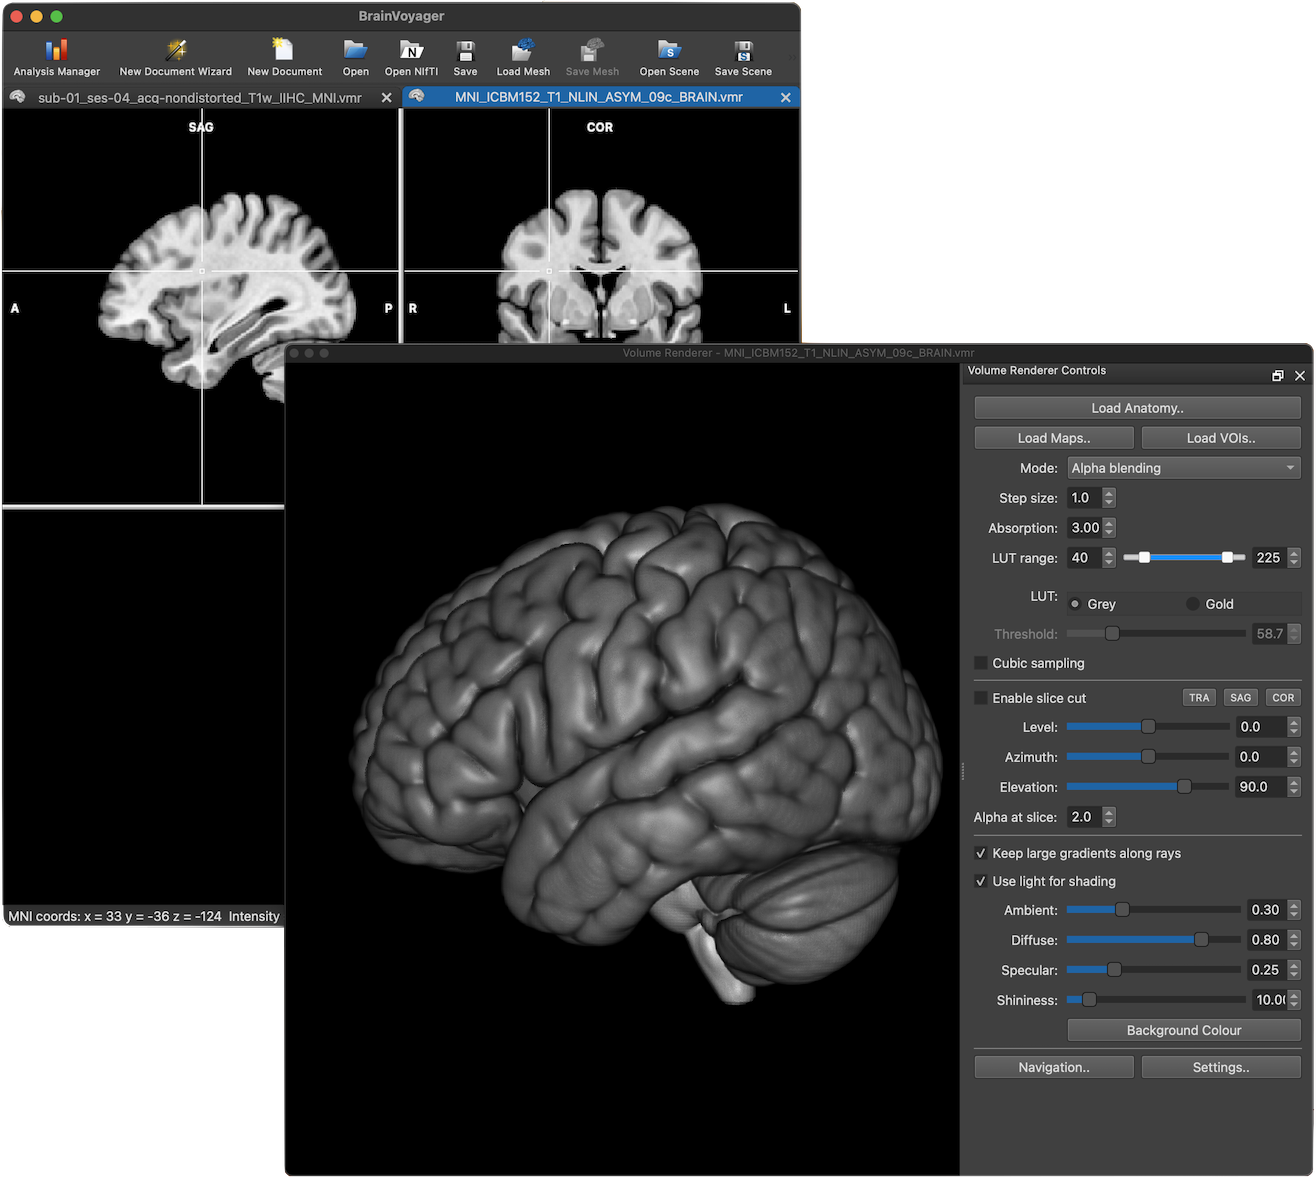
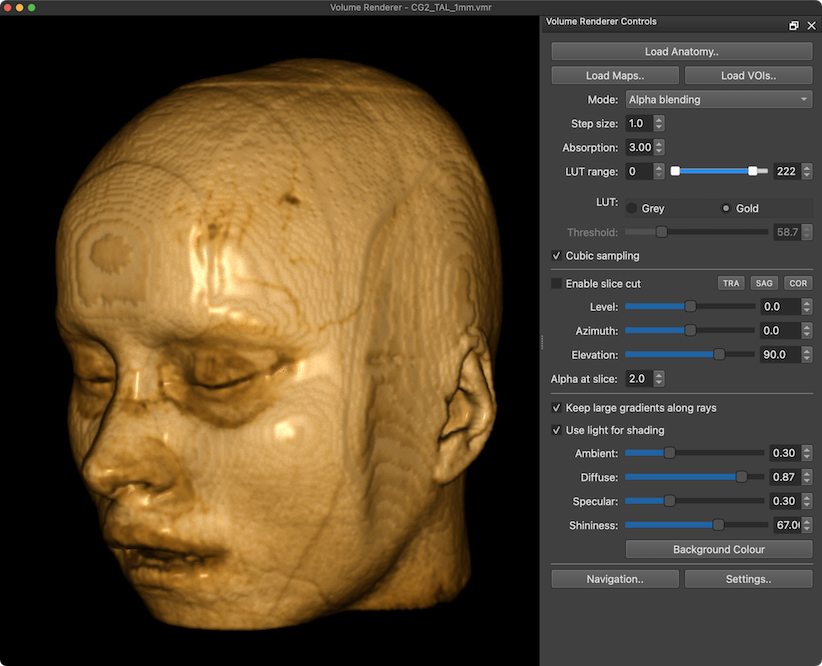
After launching the Volume Renderer, the Volume Renderer window appears displaying a volume rendered view of the current anatomical data (VMR) in the Render View together with the Volume Renderer Controls panel on the right side (see screenshot below, which displays a MNI template brain that can be loaded using the Open MNI VMR item in the File menu). The controls panel can be detached from the main renderer window by clicing the Undock icon in the upper right corner (next to the Close icon). The position and size of the render window will be re-established after closing and reopening BrainVoyager.
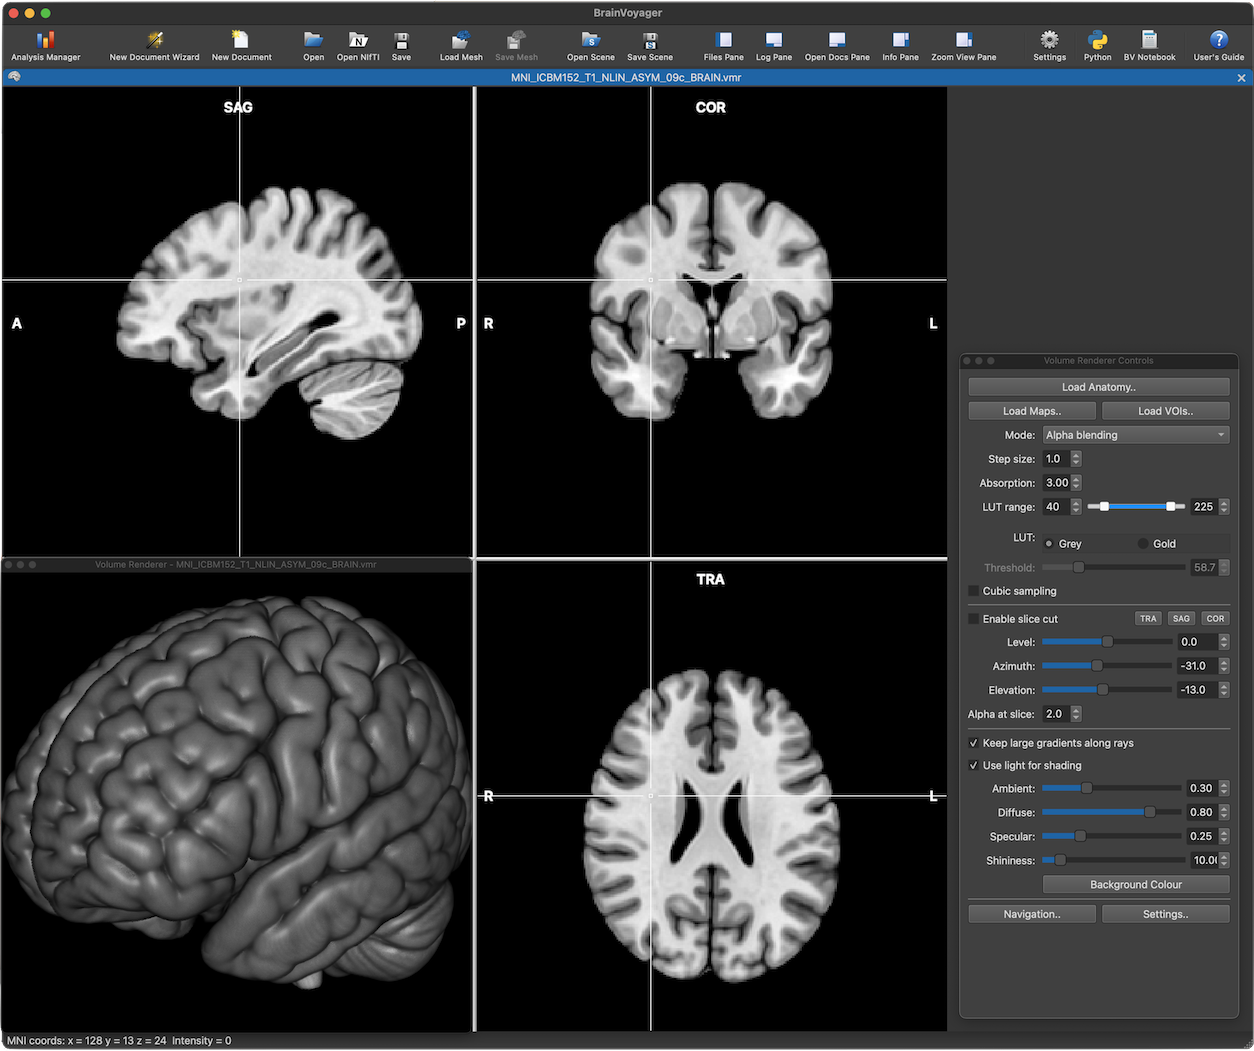
 The screenshot below shows an arrangement where the Volume Renderer window is placed in the lower left quadrant of a VMR View with the Volume Renderer Controls panel detached and placed on the right side next to the VMR View.
Navigation
The volume renderer supports real-time navigation of rendered scenes in a very similar way as in the 3D mesh viewer, e.g. it is possible to translate and rotate the viewpoint easily using mouse and keyboard controls. One can, for example, hold the left mouse button down while dragging left/right and up/down in the volume renderer window to rotate the viewpoint. Holding down the right mouse button while dragging left/right and up/down will shift the viewpoint, i.e. the rendered volume is moved left/right and up/down Zooming in and out can be done by moving the mouse forward and backward while holding down both mouse buttons or by rotating the mouse wheel if available.
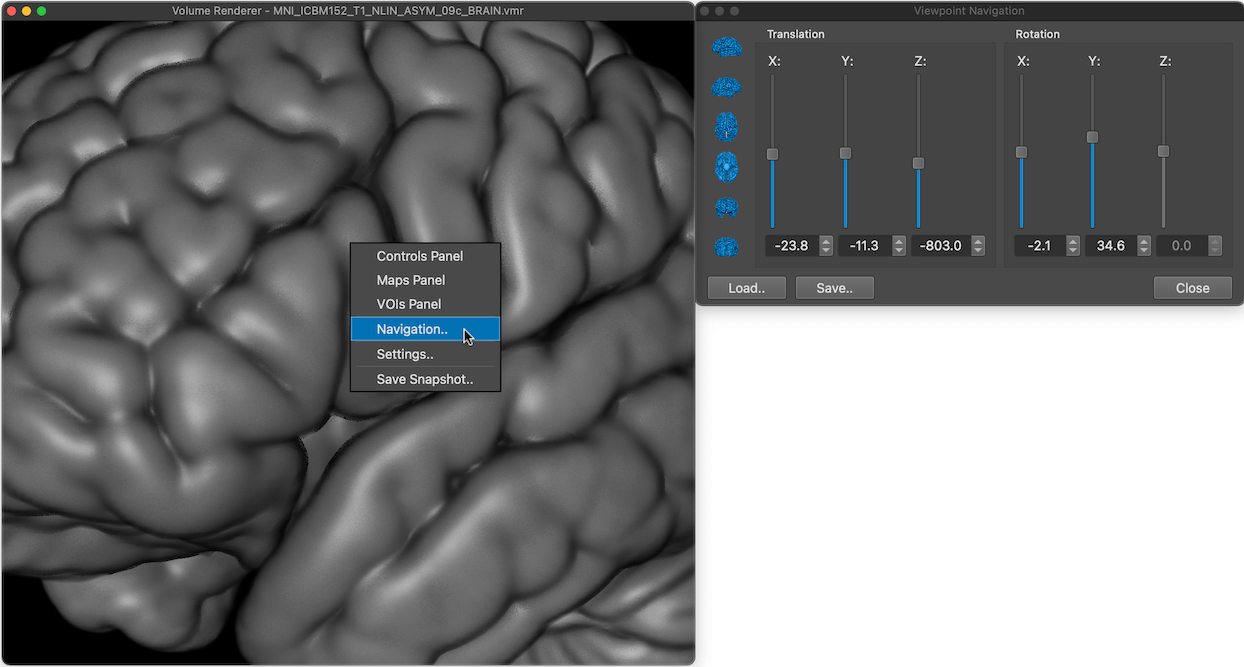
Further navigation options are available in the Navigation dialog that can be invoked using the Navigation button at the bottom of the Volume Renderer Controls panel or by using the context menu of the Render view (see screenshot above). The Navigation dialog also works very similar to the one of the 3D Viewer containing sliders to translate and rotate the viewpoint around the X, Y, and Z axes. Furthermore, clicking the Standard Viewpoints icons on the left side of the dialog allows to quickly (re-)set a standard viewpoint looking at the imaged volume from the left, right, front, back, top and bottom.
Fundamental Volume Rendering Parameters
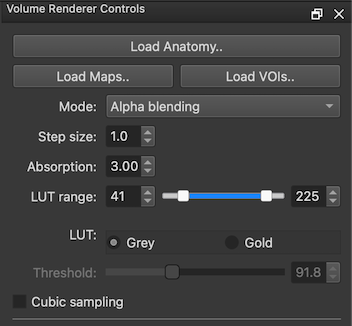
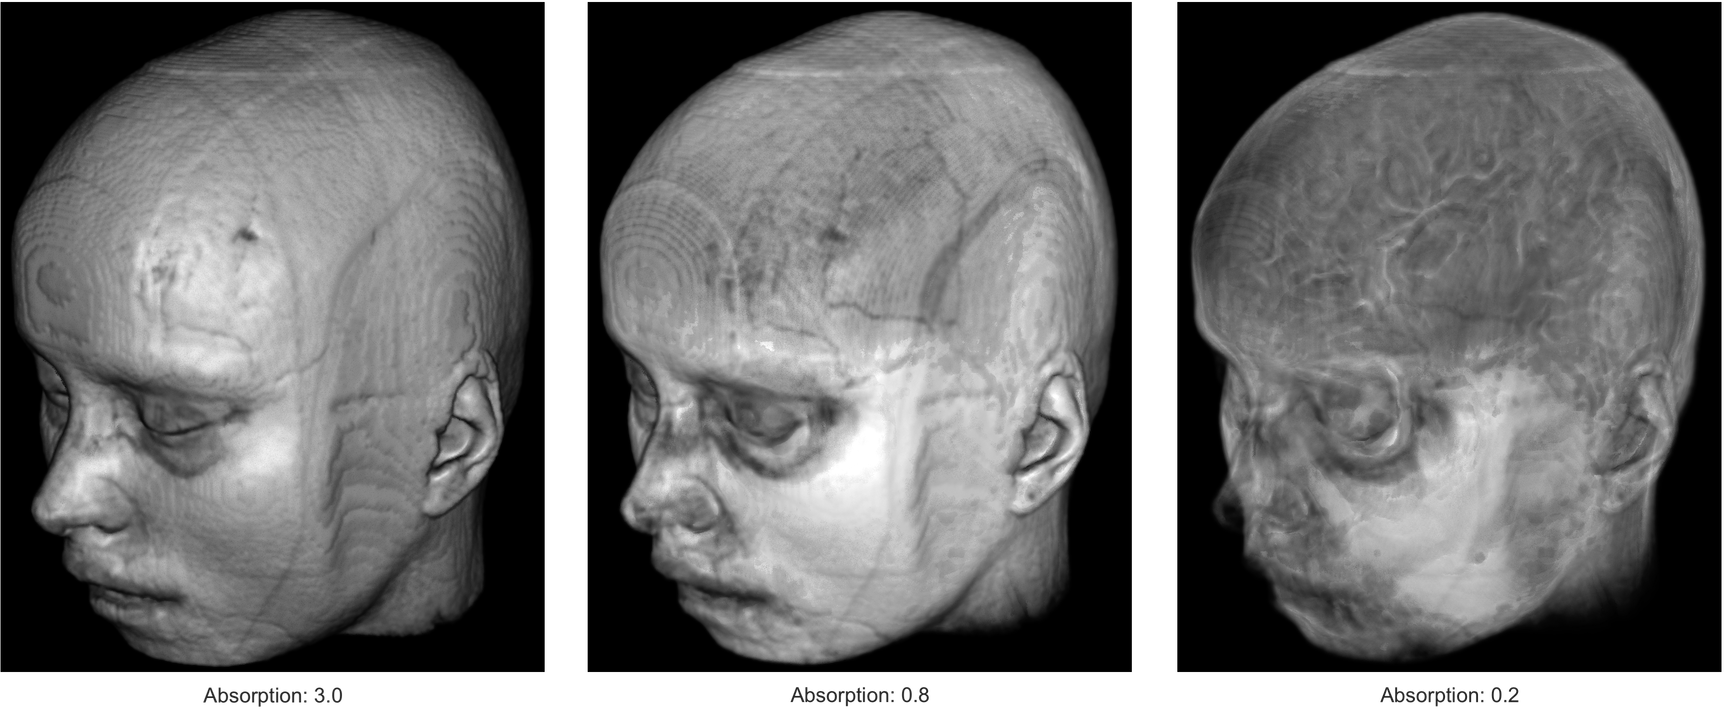
The upper part of the Volume Renderer Controls panel contains user interface elements that can be used to influence basic volume rendering parameters. The Mode field is set to 'Alpha blending' as default, since it is required for proper volume rendering. The two other modes are 'Isosurface' and 'MIP' (maximum intensity projection) that are described in section X. The Step size spin box influences the size of the steps made along rays send into the volume from the image plane. The default value of '1.0' needs usually not to be changed; larger values lead to faster rendering, but lower image quality showing less detail and aliasing effects. Step size values smaller than 1.0 lead to longer rendering time without necessarily rendering improvements. Tthe Absorption value is fundamental to volume rendering since it determines how much depth information will be integrated to calculate the final image: lower absorption values increase tissue transparency. The default value of '3.0' is very high resulting in renderings that are 'saturated' quickly, i.e. rendering results reflect mainly the surface of the rendered object. The figure below shows volume rendering results with three different absorption values (3.0 (default), 0.8, 0.2) showing increasing depth information.
Another fundamental parameter of volume rendering is the mapping from intensity values to color values, which is controlled by a look-up table (LUT). Since in BrainVoyager the major goal of volume rendering is to visualize brains with colored map overlay, intensity values of anatomical data are mapped to grey scale values as default. Using the Gold option in the LUT field provides a mapping of intensity values in a "gold" color range (see screenshot below).
Besides mapping intensity values to color values, intensity values can also be excluded (set to transparent). the mapping The LUT range range slider allows to exclude low intensity values by changing the left ('threshold') intensity level of the range slider. The right slider can be moved to the left side to lower the upper intensity value of the mapped intensity range. Note, however, that the upper intensity range value is not excluding high intensity values but all intensity values at this level and higher are mapped to the highest LUT value (this is similar to mapping color values for statistical map overlays).
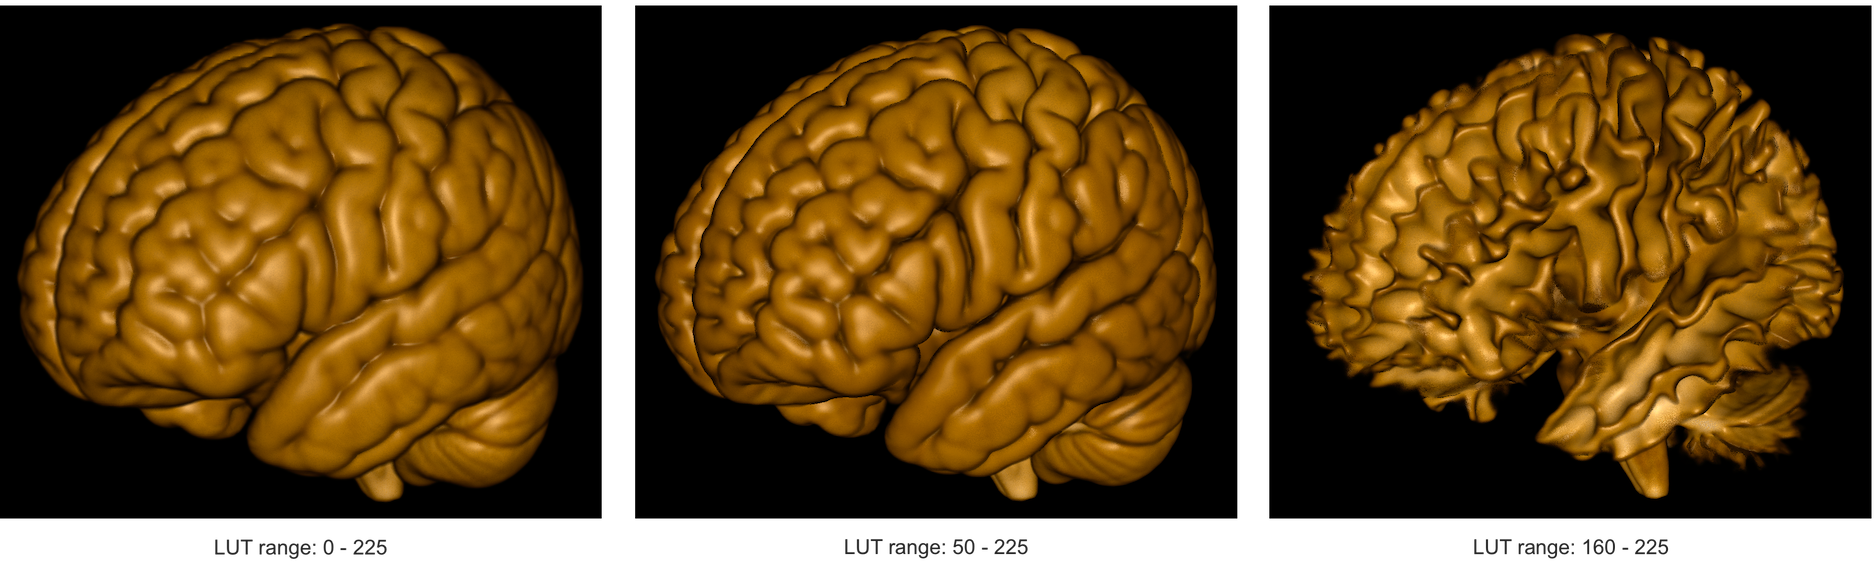
The screenshot above shows how increasing the lower ('threshold') value of the range slider leads to the exclusion of increasingly higher intensity values. The image on the left shows the result when not excluding any intensity values (LUT range = 0 - 225); the image in the middle excludes intensity values below '50', which leads to a sharpter grey matter boundary by removing tissue in front of grey matter; the image on the right shows results when using a high lower intensity threshold value (160): since this value is beyond the intensities of grey matter, the cortical tissue is largely removed and white matter tissue is exposed. Note that such a white matter view of the brain is obtained without white matter segmentation and surface reconstruction as is necessary when working with mesh representations.
An option that influences the quality of volume rendering is the chosen interpolation method. The program uses trilinear interpolation as default when sampling intensity values along the rays marching into the imaging volume. Better results can be obtained when using cubic interpolation that can be turned on using the Cubic sampling option. This interpolation option requires more compute time than trilinear interpolation, but as long as the real-time navigation experience is not affected strongly, it is recommended to enable this option.
Copyright © 2023 Rainer Goebel. All rights reserved.