BrainVoyager v23.0
Assessing the Significance of SVMs
In order to obtain estimates about the significance of classifier accuracy results, BrainVoyager offers a permutation testing approach. In this procedure, labels are assigned randomly to the example trials, then the classifier is trained on the task with the (wrong) condition labels and finally the generalization performance is tested with a "one-leave-out" cross-validation strategy. This procedure is repeated many times and the resulting performance values provide a null distribution to which the accuracy value obtained from separate test data can be compared. Although performance on the test data with respect to the null distribution provides the most important information, it is also possible and informative to relate the one-leave-out generalization performance of the training data to the created null distribution.
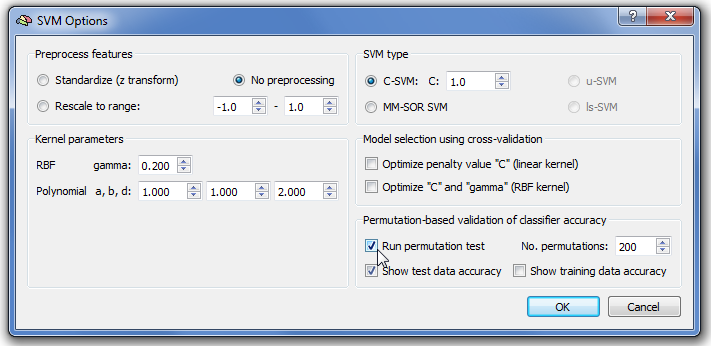
To run the permutation test, one needs to launch the SVM Options dialog by clicking the Options button in the Support Vector Machine (SVM) field of the Multi-Voxel Pattern Analysis dialog. As indicated with the arrow in the snapshot above, one needs to check the Run permutation test option in the Permutation-based validation of classifier accuracy field. You may also change the number of permutations to perform using the No. permutations spin box; while the default value of 200 is usually high enough to obtain a representative null distribution, a value of 1000 (or even higher) will produce slightly more robust results. The Show test data accuracy option is turned on as default; this option will add a red disk in the produced null distribution box-and-whisker plot (see below) indicating the generalization performance of the classifier when trained with the correct labels. Note that this comparison requires that a test data MVP file is selected in the Test data text box in the ROI-MVPA data field in the ROI-SVM tab of the main dialog. The Show training data accuracy option can also be checked (it is off as default); this option will add a yellow disk in the produced null distribution box-and-whisker plot (see below) indicating the one-leave-out performance on the training data when the classifier is trained with the correct labels.
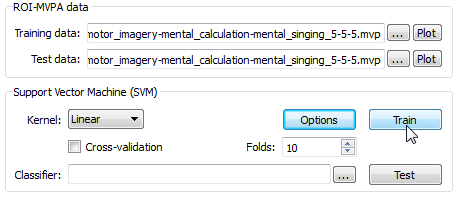
After specifying permutation testing, the SVM Options dialog can be closed using the OK button. To run the permutation test one needs to click the Train button in the Support Vector Machine (SVM) field in the main dialog (see above). While running the permutation test, the Log pane will print the obtained leave-one-out accuracy for each executed permutation of the labels. At the end of the permutation test, a box-and-whisker plot is presented (see snapshot below) indicating the distribution of obtained accuracy values across all permutation tests. The blue line indicates the median of the distribution that will be close to the expected chance level (33.3% in the 3-class example); the lower boundary line of the green box indicates the 25% percentile and the upper line the 75% percentile; the red line indicates the 95% percentile that can be used to assess significance of accuracy values. The lower/upper end point of the white vertical line indicate the minimum/maximum accuracy value obtained during permutation testing; all values characterizing the box-whisker plot are also printed in the Log pane. Note that the obtained null distribution is not normal in case that more than two classes are used for training.
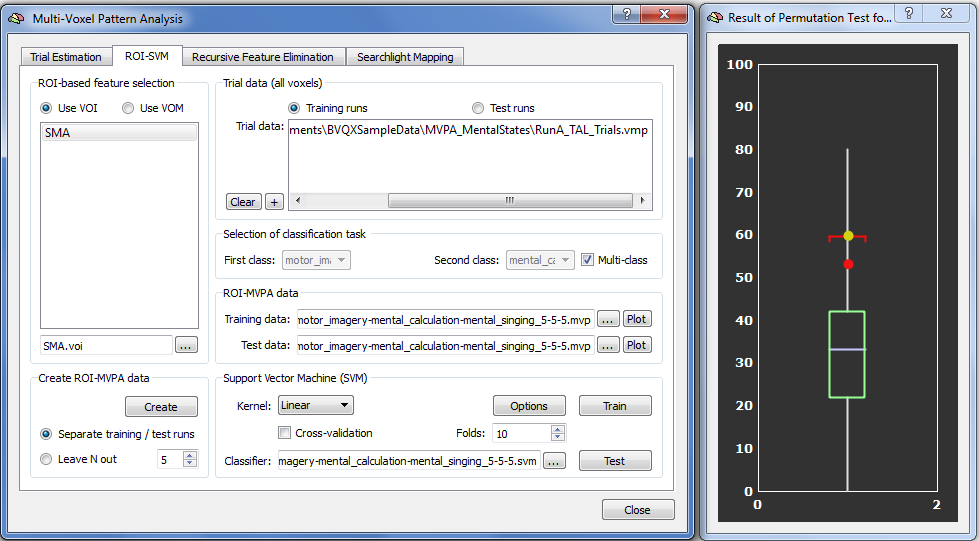
Besides the box-and-whisker null distribution plot, a red disk shows the performance value that is obtained when using the provided test data. While the red point is substantially higher than the chance level of 33%, it does not reach the 95% percentile of the null distribution and would, thus, not be significant (using standard conventions). The obtained accuracy is also printed to the Log (53.3% in this example). Note that the red point is only shown if the Show test data accuracy option has been enabled (default) as described above. A second yellow disk is shown in case that the Training data accuracy option has been enabled (see description above); the yellow disk shows the accuracy value that is obtained when using the leave-one-out generalization test on the training data (using the correct labels, of course); in the example case, the yellow disk is located just above the red threshold line (indicating the 95% percentile) and can be regarded as significant (p < 0.05); note, however, that the critical accuracy is represented by the red disk that reflects the accuracy of the test data.
Note that the box-and-whisker plot can not be made active (e.g. it can not be moved or resized) as long as the Multi-Voxel Pattern Analysis dialog is open since this dialog is a "modal" (blocking) dialog; the dialog is kept open to allow running further routines; in order to access the box-whisker-plot, one needs to dismiss the dialog clicking the Close button.
Copyright © 2023 Rainer Goebel. All rights reserved.