BrainVoyager v23.0
Data Analysis Manager for Reproducible Analysis Pipelines and Quality Reports
The data analysis management tools (introduced first in version 20) enable a systematic way in BrainVoyager to manage and analyze (large) datasets: Instead of isolated documents, data is structured in a hierarchically organized format describing projects, subjects, sessions as well as workflows and analysis pipelines producing output data. The explicit specification of parameters in preprocessing and data analysis workflows provides transparency and reprroducibility. Since BrainVoyager 21, the generated organization of the data on disk follows the Brain Imaging Data Structure (BIDS) recommendation supporting collaboration and data sharing. Inside top level project folder(s), directories for specific projects are created containing extensible information about the project, subjects, workflows and analyzed data of a research experiment or clinical study. Since BrainVoyager 22.2, data management relies on the predictable BIDS folder tree structure and adds metadata JSON files making it unnecessary to keep information stored in a separate (MySQL) database as in previous versions. Furthermore, BrainVoyager 22.2 added an underlying data management programming API that makes it possible to manage projects in the same way either via the Data Analysis Manager window (see below) or via succinct Python code in BrainVoyager Notebooks. The figure below provides an overview about the data and typical operations performed when using the data management tools.

Figure 1. Data analysis management: Relationship between data and major operations. After creating a project folder inside the Projects directory, commands via Python scripts or the Data Analysis Manager window call the same functions of the 'Projects and Workflows' application programming interface (API). In case that data is already available as NIfTI files, they can be placed in the rawdata folder (see below). If data is available as source DICOM files, they can be converted to NIfTI files using the DICOM To NIfTI batch converter tool, the standard Create Document Wizard, or via Python commands in scripts. To process the data in the same transparent way across all available subjects, workflows (tasks) are defined and connected to form processing pipelines. Workflows at a later stage of a pipeline typically use data from workflows at earlier stages or data from the NIfTI raw data. Besides produced data, workflows also generate visual reports with animations in the form of BrainVoyager notebooks.
The figure below shows how the data is organized hierarchically on disk. Besides a semantic name in each box (bold font), the second text line shows example folder names as well as the parent folder; the name 'rawdata/sub-01' for example, provides an example of a folder of a subject ('sub-01') with respect to its parent folder ('rawdata'). Each project is identified by a unique name inside a top-level Projects directory, which points as default to the user's "Documents/BrainVoyager/Projects" folder. Note that the Projects path can be changed to point to any accessible local or remote (network) directory. It is, thus, easily possible to analyze local or remote datasets. Each specific project has a folder with its name inside the current Projects folder. Inside the folder of a specific project, the two folders "rawdata" and "derivatives" contain the original (unprocessed, raw) NIfTI data files and any derived (analyzed) data, respectively. Added subjects (participants of a study) or workflows are automatically detected and added to the project visualization in the Data Analysis Manager or printed when requested in a Python notebook. Subject folders added to a project must be identifiable by a unique BIDS code 'sub-{name}' (e.g. "sub-07", "sub-47", "sub-283") corresponding to the name of the folder on disk containing the subject's data. Number codes for subjects, sessions, runs should have a leading zero if smaller than 10, i.e. the number 4 should be coded as '04'. Additional information about subjects and workflows is stored in JSON files at the corresponding level of the project directory tree. One or more created workflows define pipelines that process input data of multiple subjects in a consistent way to create derived (intermediate or final) reproducible output data. When workflows are executed, produced datasets will be automatically named in a consistent way and added to the 'derivatives' folder with its contents organzied according to BIDS in the same way as the data in the 'rawdata' folder. The program discovers the number of subjects, available data and workflows automatically each time a project is accessed. This makes it possible to update projects via the data management tools, Python code, or via direct file operations (creating and copying data in the right place manually). Original NIfTI as well as produced (BrainVoyager) files can be opened in BrainVoyager's standard multi-document area by clicking on entries in the Data tab of the Data Analysis Manager (see below).

Figure 2. Data analysis management: Hierarchical organization of data in a Projects directory. The data in the rawdata folder inside each project is organized according to BIDS. The output of each workflow (task) is stored in a separate workflow folder inside the derivatives directory. The data inside a workflow is organized according to BIDS but will only contain directores of relevant data; if a workflow analyzes, for example, functional data, running the workflow will only create the func folders inside the session folder(s) of each subject but not an anat folder.
Note. The old data analysis management tools are still available in this release but marked as deprecated. It is possible to switch between the two data managers using the Select Data Analysis Manager field in the GUI tab of the Preferences dialog. The old Data Analysis Manager will be removed in the next major release (BrainVoyager 23). Because of some differences, you should not use both (old and new) data analysis managers for the same project. If you have ongoing projects started with the old manager, you may want to finish such projects with the old one and use the new data analysis manager for new projects. Alternatively (recommended), you can redefine the respective workflows in the new data analysis manager (or via Python code) and rerun the analysis. The old manager expects data as default in the "Documents/BrainVoyagerData" folder while the new manager expects the data as default in the "Documents/BrainVoyager/Projects" folder. An important difference between the old and new data organization is that the new management tools expect the original NIfTI data in the "rawdata" sub-folder under the main folder of the project while in the old manager, the subjects' data was placed directly under the project folder (no "rawdata" folder). If you want to use old project datasets with the new data analysis manager, you need to move all "sub-[id]" folders inside the project folder into a created "rawdata" folder.
Datasets created by workflows can itself serve as input for other workflows creating powerful processing pipelines. Since workflows process data in the same way for all available subjects, they implement a batch processing mechanism without the need to write scripts. Furthermore, workfows create detailed visual reports as BrainVoyager notebooks as a basis for quality assurance and for documentation of performed analysis steps. At present, the available workflows support anatomical and functional preprocersssing, alignment of functional and anatomical data, normalization into MNI or Talairach space and statistical (GLM) analysis at the level of single subjects and groups. Pipelines for diffuson-weighted data and other computational routines (e.g. machine learning, cortex-based alignment) are planned for a later release. Based on discoverable BIDS directory trees, the information from all defined projects is always up-to-date and presented in tables in the Data Analysis Manager window. Furthermore the data can be easily moved to other locations, for example, to relocate experiments to another computer or to share the data with colleagues. To be available after moving projects, one only needs to change the Projects folder via Python code or by using the Browse button next to the Default projects path field in the Data Analysis Manager window (see below).
Since the new data management tools rely on BIDS, datasets will be organized accordingly. Note, however, that BIDS currently standardizes the folder structure and file naming only for raw data. In order to be compatible with the evolving recommendation for derived (preprocessed, analyzed) data, the Data Analysis Manger saves derived data from preprocessing and analysis workflows in the “derivatives” folder under the top-level project folder. Note that for sharing raw data in BIDS format, one can simply copy (or upload) the rawdata folder inside the main project folder.
While the raw data files are stored in NIfTI format with sidecar files as required by BIDS, the generated (intermediate) data files are stored at present in conventional BrainVoyager file formats (FMR-STC, VMR-VTC., ..). For future versions it is planned to add the possibility to store the derived data in NIfTI files together with JSON sidecar files.
The Data Analysis Manager
The Data Analysis Manager window (see screenshot below) provides easy visual access to subjects, workflows and reports for each project in the currently specified projects path, which is set as default to the path "Documents/BrainVoyager/Projects". The window might be configured to appear automatically at program start. To turn this off, the Start At Launch option in the right lower section of the window can be unchecked. The Data Analysis Manager window can be invoked at any time using the Analysis Manager icon at the left side of the Toolbar of the main BrainVoyager window or with the keyboard shortcut CTRL-D (CMD-D on Mac) or by clicking the Data Analysis Manager item in the File menu. Note that using the data management tools is optional, and it is also possible to mix workflow and conventional (single-document) tools, e.g. by performing basic analysis pipelines with data manager workflows and to continue with more specific tools afterwards.
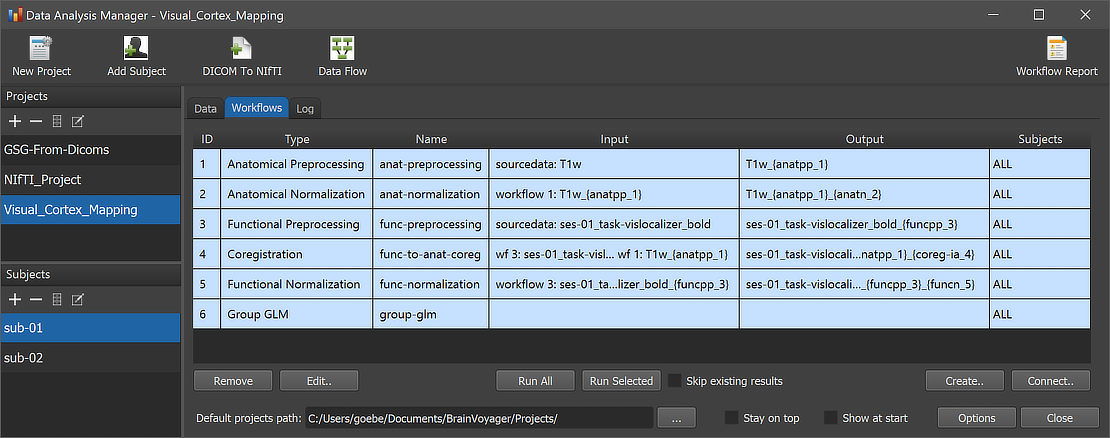
The Projects pane on the left upper side contains a list of all discovered projects in the current Projects path as specified in the Default projects path entry at the bottom of the window. In case that projects are avaialbe, the program automatically selects the last inspected project in the Projects pane. Any available project can be selected by clicking its name. When a project is selected in the Projects pane its associated data about subjects and workflows is retrieved from the project's BIDS directory tree and shown in the Subjects pane (left lower section), and in the Workflows and Data tabs in the main section of the window. Here one can switch between data and workflow tables as well as logged output using the Data, Workflow and Log tabs. If a specific subject is selected, the data of this subject is shown in the subject-level data table in the Data tab.
The following topics describe the most important functions offered by the Data Analysis Manager:
- Create new projects
- Add subjects to a project
- Add NIfTI datasets, eventually converted from DICOM files
- Define and run workflows for preprocessing and GLM statistics
- Inspect quality reports and data flow visualizations
Copyright © 2023 Rainer Goebel. All rights reserved.