BrainVoyager v23.0
ADC and FA Maps on Measured Slices
If a DDT file has been estimated or loaded from disk, mean diffusivity and fractional anisotropy maps can be computed and overlaid on DMR slices (see snapshots below).
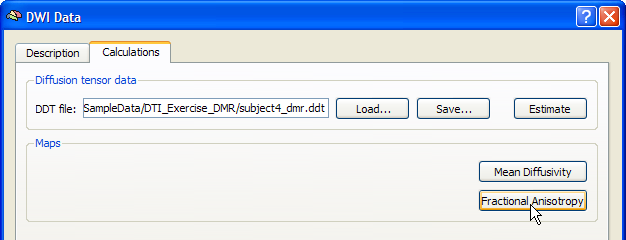
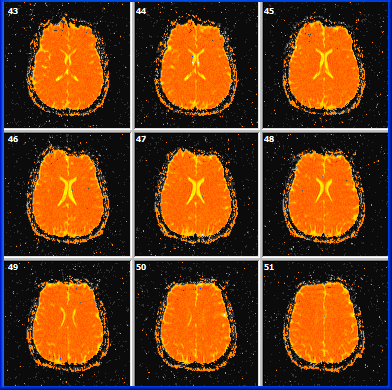
The three eigenvalues of the estimated diffusion tensor can be used to calculate the overall amount of diffusion in a voxel. In a mean diffusivity (ADC) map all three eigenvalues are simply averaged (or summed) to quantify the amount of diffusion. The snapshot below shows some slices of a DWI data set with a overlaid mean diffusivity map that has been obtained after clicking the Mean Diffusivity button in the Calculations tab of the DWI Data dialog (see snapshot above). The snapshot below shows that diffusion is highest in cerebro-spinal fluid (ventricles and large vessels).
A more interesting map is obtained by clicking the Fractional Anisotropy button in the Calculations tab of the DWI Data dialog (see snapshot above). A fractional anisotropy map quantifies the amount of anisotropic diffusion by comparing the values of the three eigenvalues of the three eigenvectors (directions) of the diffusion tensor. If all three eigenvectors of a voxel have an eigenvalue of similar magnitude, the diffusion is isotropic and the specified ellipsoid will be close to a sphere. If the eigenvalue of one eigenvector is large and the other two eigenvalues are small, diffusion is highly anisotropic and the ellipsoid will look like a cigar. The most common measure quantifying anisotropy is fractional anisotropy (FA) determining the fraction of the diffusion tensor that can be ascribed to anisotropic diffusion. FA is calculated as the normalized variance of the three eigenvalues. The FA value varies between 0 (isotropic diffusion, shape of a sphere) and 1 (infinite anisotropy, shape of a line). The snapshot below shows a set of DMR slices superimposed with a calculated FA map. The figure shows that anisotropy is high (yellow color) in white matter but low (orange color) in grey matter.
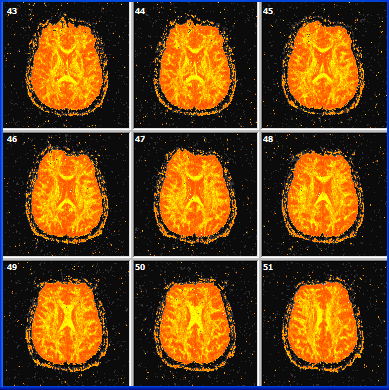
The anisotropy values are scaled by a factor of 10 for easier thresholding. To change the anisotropy threshold, invoke the Statistical Maps dialog by selecting Overlay Volume Maps in the Analysis menu and change the values in the Min and Max spin boxes in the Confidence range field. In order to calculate additional maps and to perform fiber tracking, the diffusion data has to be transformed from DMR space into aligned 3D space.
Copyright © 2023 Rainer Goebel. All rights reserved.