BrainVoyager v23.0
VTC-VTC Alignment Of Multiple Runs
Analyzing sub-millimeter fMRI data poses specific challenges for the alignment of the data from multiple runs of an experiment within a scanning session since even small misalignments will strongly reduce the detectability of fine-grained feature or layer-specific mesoscopic activation clusters. The alignment of sub-millimeter resolution fMRI runs is also very difficult since such experiments usually acquire only a small portion (slab) of the brain, especially when using the 3D GRASE sequence. While within-run motion correction usually works fine within such slabs, motion correction across runs to the same volume of one run (recommended for whole brain data) provides often sub-optimal results. In order to get best results for within-run motion correction it is thus advised to use the first volume of a run as a target for motion correction in FMR space avoiding alignment to data of another run. This implies, however, that no alignment is performed across runs. In order to perform optimal across-run alignment the VTC-VTC Grid Search Alignment tool has been introduced in BrainVoyager 20 that works at the level of VTC data. The tool can be invoked by clicking the VTC-VTC Grid Search Alignment item in the Analysis menu. It is recommended to use this tool with functional data that has been transformed to VTCs in original FMR space that allow to analyze high-resolution data without voxel resampling (besides preprocessing within FMR space). Working in FMR-VTC space will also ensure that the VTCs of all runs will have the same bounding box values corresponding to the dimensions of the original FMR data. The VTC-VTC alignment tool checks the bounding box of provided data sets and will only work if their bounding boxes are identical.
Finding Best-Fit Transformation Values
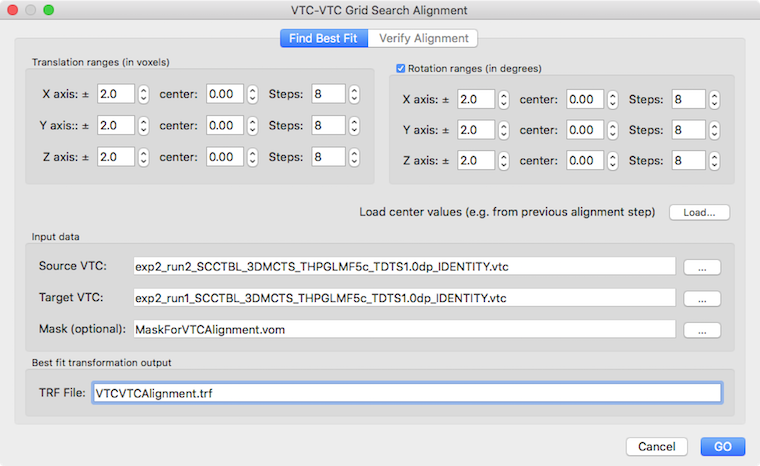
The VTC-VTC alignment tool uses spatial cross-correlation to assess how well the first volumes of two provided runs, the source VTC volume and target VTC volume, match each other. To specify the source and target VTC, the Select Source VTC and Select Target VTC button can be used, respectively, in the Find Best Fit tab. The selected file names will be shown in the corresponding Source VTC and Target VTC text boxes. Since functional data acquired in a small slab often contain intensity values with little anatomical contrast, standard gradient based alignment techniques may fail to find an optimal alignment. To avoid being stuck in local minima, the VTC-VTC tool therefore explores translation and rotation values in provided parameter ranges. Each parameter is changed in small increments and all combinations of parameter values form a set of transformations that are used for systematic testing (this is usually referred to as "grid search"). For each combination of parameter values a transformation of the source VTC is performed and the match between the transformed VTC and the target VTC is accessed by calculating a spatial correlation value as a measure of fit. The transformation (combination of parameter values) that provides the highest spatial correlation value is selected as the best fit and displayed for inspection in the Verify Alignment tab (see below). The obtained best fit transformation is also saved to disk as a .TRF file that can subsequently be used to apply the translation/rotation parameters to all volumes of the source VTC using the VTC Spatial Transformation dialog (see below).
The parameter ranges to be explored can be provided in the Translation ranges (in voxels) field and the Rotation ranges (in degrees) field, respectively. As default, rotation parameters are included but the search can also be restricted to 3 translation parameters (not recommended) by unchecking the Rotation ranges field. The values in the center fields (3 for translation along the X, Y and Z axis and 3 for rotation around the X, Y and Z axis, respectively) specify starting values for the respective parameters and are set to 0.0 as default. Note that the tool can be applied multiple times, e.g. first with a broader parameter search range and later with a more narrow search range around previously determined transformation values. For this purpose, the center values can be changed by entering values as text or by using the respective spin boxes. More conveniently, the center values can be set to the best fit values from a previous appliation by loading the respective .TRF file using the Load button on the right side of the Load center values text. The range of values used for a specific parameter is specified using the text fields labeled X axis ± Y axis ± and Z axis ± in the left column of the Translation ranges and Rotation ranges fields. if a range value is, for example, set to 2.0, parameters will be generated from -2.0 to +2.0 around the center value. The number of steps is specified in the corresponding Steps field on the right side for each parameter. With the default value of 8, 8 steps from the start value will be generated resulting in 9 (n+1) different parameter values. In the case of a range from -2.0 to 2.0 for a translation parameter, the following values will be generated: -2.0, -1.5, -1.0, -0.5, 0.0, 0.5, 1.0, 1.5, 2.0, i.e. the granularity of parameter exploration would be in increments of 0.5 voxels (or 0.5 degrees for rotation parameters). If the same number of 8 steps will be chosen for translation and rotation parameters, a total number of 531441 (96) parameter combinations for testing, which should be completed on a modern computer in a few minutes. Note that the number of values per parameter and the overall number of performed transformations is printed in the Log tab of BrainVoyager among other useful information. To increase the grnaularity of the "search grid" further, more steps (e.g. 16) could be specified but this will lead to very long calculation times (176, i.e. more than 24 million transformations and evaluations). It is, thus, recommended to keep a small number of steps (in the range of 4-12) and to repeat the process a second time with a more narrow search space starting with the parameter values discovered in the first step as indicated above and using as range the value of the previous step granularity (e.g. 0.5 instead of 2.0 in the example above).
In case that the region of interest in the data slab is rather small - as is often the case when performing sub-millimeter fMRI experiments - it is advised to define and use a mask that will be used to limit the spatial correlation assessment to voxels in that region. This not only makes the alignment more focused to the interesting region but it also speeds up the evaluation process since less voxels are used to calculate spatial correlation values. To get a mask standard BrainVoyager tools can be used in the hosting VMR to create a VOI that can be converted into a VOM file. A VOM file is required as input since the VTC-VTC alignment procedure needs a definition of the ROI in coordinates within the dimensions of the VTCs as opposed to VOI coordinates that are defined relative to the dimensions of the hosting VMR. To convert a VOI into a VOM region-of-interest, the Create VOMs dialog can be used that can be invoked using the Create VOM item in the Options menu. The created VOM file can be used for the VTC-VTC alignemnt procedure by selecting it using the Select Mask button. The selected VOM file name will appear in the Mask (optional) text field.
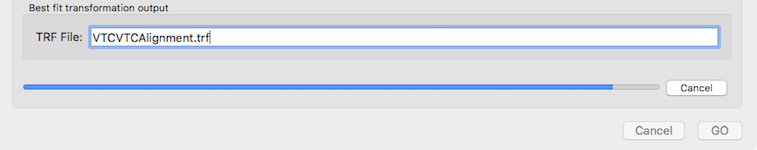
The grid search is started by clicking the GO button. This will trigger changes in the dialog preventing further changes. It will also display a progress bar with a Cancel button (see snapshot above) that can be used to interrupt the process. Interruption will return as best-fit values the values internally generated at that moment and the values should not be considered useful. If a too amibtions grnaulariy had been used, the process should be repeated with smaller numbers for the parameter steps. As soon as the VTC-VTC alignemnt grid search procedure has been competed (or interrupted), the Verify Alignment tab will be available for inspection of the discovered best-fit transformation parameters.
Inspecting Best-Fit Transformation Values
The Verify Alignment tab (see screenshot below) can be used to inspect the transformation resulting from the best-fit parameter values. After finishing the grid search procedure (or after canceling the process), the program automatically switches from the Find Best Fit tab to the Verify Alignment tab. The found values of the transformation parameters that achieve the highest spatial correlation value between the transformed source VTC volume and target VTC volume are shown in the TRF values row containing the three translation values in the TX, TY and TZ text boxes and the three rotation values in the RX, RY and RZ text boxes. While the best-fit transformation values are saved automatically to disk (with a name specified in the TRF File field of the Find Best Fit tab), the (modified) values in the text boxes can also be saved later using the Save button in the Verify Alignment tab.
The Verify Alignment tab contains several tools to assess the achieved alignment of the volume transformed with the values in the top row (transformed source VTC volume) with the target VTC volume. The dialog allows to show slices through the source voume, the target volume as well as the transformed source volume. To display a slice of the source VTC volume, the Source VTC option needs to be checked; to see the same slice through the transformed source volume, the Transformed source VTC option needs to be checked and to see the same slice through the target volume, the Target VTC option must be selected. The transformed source VTC volume is shown initially and the correlation value resulting from spatial correlation of the (masked) transformed source and target VTC volume is shown on the right side (r = [value]). Without changes of the parameters in the top row, the displayed correlation value corresponds to the best-fit transformation, i.e. it is the highest correlation value discovered during grid search when using the parameters shown in the TRF values row (r = 0.948639 in the example above). In case that the parameter values in the top row are changed, a new transformed VTC volume is created and the corresponding spatial correlation value between the new transformed source volume and the target volume. If the Source VTC option is selected the spatial correlation between the unmodified source volume and the target volume is displayed in the correlation text field. Since this represents the alignment before running the grid search procedure, a comparison of this value (r = 0.804333 in the example above) with the best-fit correlation value (r = 0.948639 in the example above) reveals the increase in alignment between the transformed source and target VTC volume over the non-transformed source-target alignment. The slice depicted in the image window can be changed by selecting a specific slice orientation using the TRA, SAG and COR options and by selecting a specific slice index for the selected slice orientation in the associated text fields; initially a transversal slice in the middle of the volumes is selected. Instead of selecting a source, transformed source and target VTC volume by clicking the respective options, a more convenient way is provided with the Toggle Src-Trg button and the Toggle TrfSrc-Trg button. When clicking the Toggle-Src-Trg button repeatedly, the source volume and target volume are shown alternatively. More conveniently, when clicking and holding down the mouse, the source and target volume will toggle back and forth until the mouse press is released (see animation above). Using the Toggle TrfSrc-Trg button works in the same way but it toggles between the transformed source volume and the target volume (see animation above).
In case that a mask has been provided, the Highlight mask voxel option is enabled and selected, i.e. the voxels within the mask are highlighted by showing the out-of-mask voxels in a dark red tone. Highlighting the masked voxels allows to easier assess the quaity of alignment within the mask voxels. In order to remove the red tone for non-masked voxels, the Highlight mask voxel option needs to be deselected.
In order to apply the best-fit transformation to all volumes of the source VTC file, the VTC spatial transformation tool can be used.
Copyright © 2023 Rainer Goebel. All rights reserved.