BrainVoyager v23.0
Second-Level RSA
The goal of second-level representational similarity analysis is to compare calculated first-level RDMs with each other in order to better understand the representational principles in brain regions (or in specific layers of a neuronal network model) by revealing what distinctions between conditions are emphasized and what distinctions are de-emphasized. Similarity structures between visual stimuli will increasingly reflect, for example, invariant and semantic information when comparing RDMs from increasingly higher brain areas along the visual hierarchy. Since the comparison of first-level RDMs does not require voxel-level correspondence, data from other sources can be easily integrated in second-level analyses, including integration of RDMs from multiple subjects, other measurement modalities and computational models. As long as the same pairwise comparisions in the same order have been made to calculate first-level RDMs, they can be compared with each other using second-level RSA analysis. This allows, for example, to compare similarities from different brain areas with similarities from different layers of a neural network model.
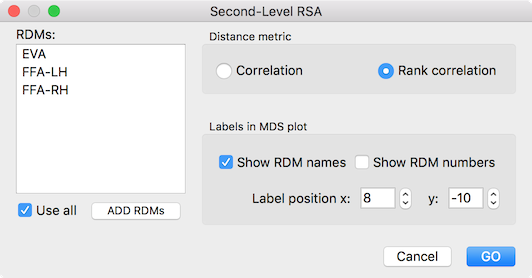
In order to compare RDMs, the Second-Level RSA dialog (see snapshot above) can be invoked from the Analysis menu. The Add RDMs button can be used to load multiple RDM files. In the example snapshot above, three RDMs have been loaded ("EVA", "FFA-LH", "FFA-RH") that had been calculated using the Representational Similarity Analysis dialog. If the Use all option is turned on (default), all first-level RDMs listed in the RDMs box will be used for calculating the second-level RDM; if this option is turned off, only the selected RDMs will be used (a minimum of two entries need to be selected). While it is possible to use Pearson correlation to calculate the second-level RDM by selecting the Correlation option, the Rank correlation option is selected as default since a non-parametric rank correlation is better suited when using 1-correlation values as input as is usually the case when calculating first-level RDMs. The settings in the Labels in MDS plot field allow to adjust the created MDS plot (see below) in the same way as described for first-level RSA. The labels in the MDS plot are built from the provided RDM names in case that the Show RDM names option is turned on. In addition to the RDM name, a number identifying the first-level RDM from the posiiton in the RDMs box can also be shown instead of the RDM name in case that the Show RDM numbers option is selected. Th Label position x and Label position y value boxes can be used to change the relative position of the label with respect to the visualized RDM data point.
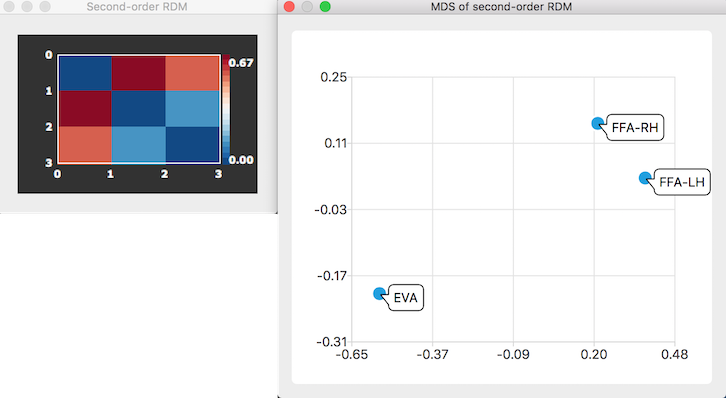
After clicking the GO button, a representational dissimilarity matrix (RDM) and a multi-dimensional scaling (MDS) plot are generated as output as described for first-level RSA analyses. The produced second-level RDM is obtained by pairwise correlation of the values in the flattened (lower triangular) matrix elements of all provided RDMs. In the snapshot above the RDM and MDS plot for the comparison of the similarity structure of the first-level RDMS of the 3 ROIs "EVA", "FFA_LH" and "FFA_RH" is shown with the resulting matrix in the Secon-Order RDM window on the left side and the MDS of second-order RDM window on the right side. As is evident from both representations, the two FFA first-level RDMs are very similar while the RDM of the early-vissual area ROI ("EVA") is dissimilar to both FFA RDMs.
Statistical Analysis
Coming soon...
Copyright © 2023 Rainer Goebel. All rights reserved.