BrainVoyager v23.0
Verification of Functional Brain Coverage
When running group GLM analyses in volume (e.g. Talairach) space, the resulting statistical maps might cover less brain space than one might expect. The reason is that BrainVoyager only calculates statistical values for those voxels in volume time course (VTC) files that have valid functional data at a given voxel across all included data sets; if voxels with incomplete data would be included, voxels in a calculated statistical maps would not be comparable since they would have different degrees-of-freedom. This strategy implies that a single "bad" data set may detoriate the spatial coverage substantially; a "bad" data set could be the result of suboptimal slice positioning in the scanner for one subject; it could also be the result of errors in the normalization process, e.g. by selecting wrong alignment files. The new functional brain coverage tool helps to identify the region containing valid functional data in individual brains and, more importantly, it calculates a color-coded probability map that allow to inspect the functional subspace that is covered by all subjects.
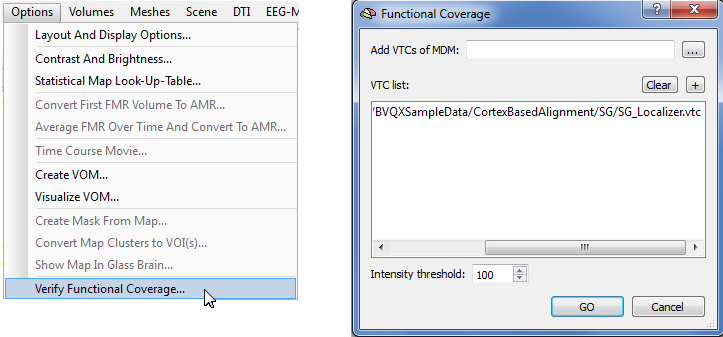
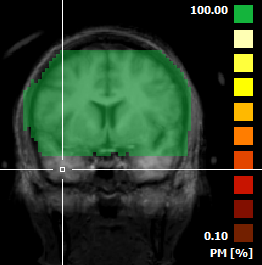
The Functional Coverage dialog can be invoked from an active VMR document using the Verify Functional Coverage item in the Options menu (see above). If a VTC file is linked to the current VMR document, it will be automatically added to the VTC list; in the example snapshot above, the "SG_Localizer.vtc" file was linked to the current VMR file and, thus, appears in the list of VTC files. In case one wants to inspect the coverage of the linked VTC file, one can simply proceed and click the OK button. The program will then show a transparent map overlaid on the underlying anatomy. The regions colored green correspond to voxels containing valid functional data (for more explanations of the color bar, see below). Note that in this example most of the brain is covered but the anterior temporal pole is not included; this may or may not be known to the researcher but with this analysis, a lack of activity in these regions can not be explained by arguing that these regions do not activate but it must be stated that no data was acquired in these regions.
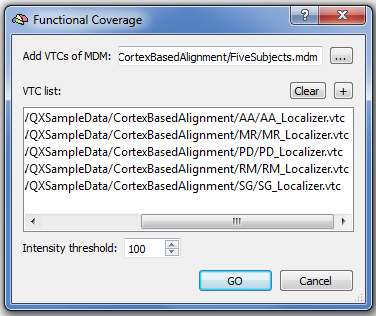
There are two ways to add multiple VTC files in order to check brain coverage for a group of subjects. One way simply involves clicking the + button to add VTC files. The second way is directly linked to a statistical group analysis: To run a multi-subject GLM, one needs to prepare a multi-study design matrix (MDM) file that is usually saved to disk for further reference. In order to add all VTC files related to a group GLM study, one can simply select the respective MDM file using the Browse ("...") button next to the Add VTCs of MDM text box. In the snapshot below, the MDM file "FiveSubjects.mdm" has been selected and the VTC list has been filled subsequently with all VTC files referenced by the selected MDM file.
To clean the VTC list, use the Clear button. Since the VTC list now contains more than one VTC file, clicking the GO button will calculate a probabilistic map that indicates overlap of included VTC files. Besides the graphical output, the bounding boxes of the included VTC files are printed in the Log pane including a summary statement indicating whether all VTC boxes have the same dimensions or not. The snapshot below shows how the result looks like for the given example. The green color indicates those voxels where all included VTC files contain functional data since an overlap of 100% of VTC files has been assigned to the color green (see top square in color bar). Probability values below 100% are assigned to yellow and red colors so that these regions can be easilty distinguished from the 100% overlap regions. The green region is a direct visualization of the area that will contain valid statistical values when one runs a multi-subject GLM with the chosen MDM file; any voxel outside the green region will be set to value 0.0 in a statistical map. Statistical data analysis uses an intensity threshold to identify voxels with valid functional data that has a default value of "100". This value is also used as default in the Functional Coverage dialog (see above), but the Intensity threshold value can be changed if desired.
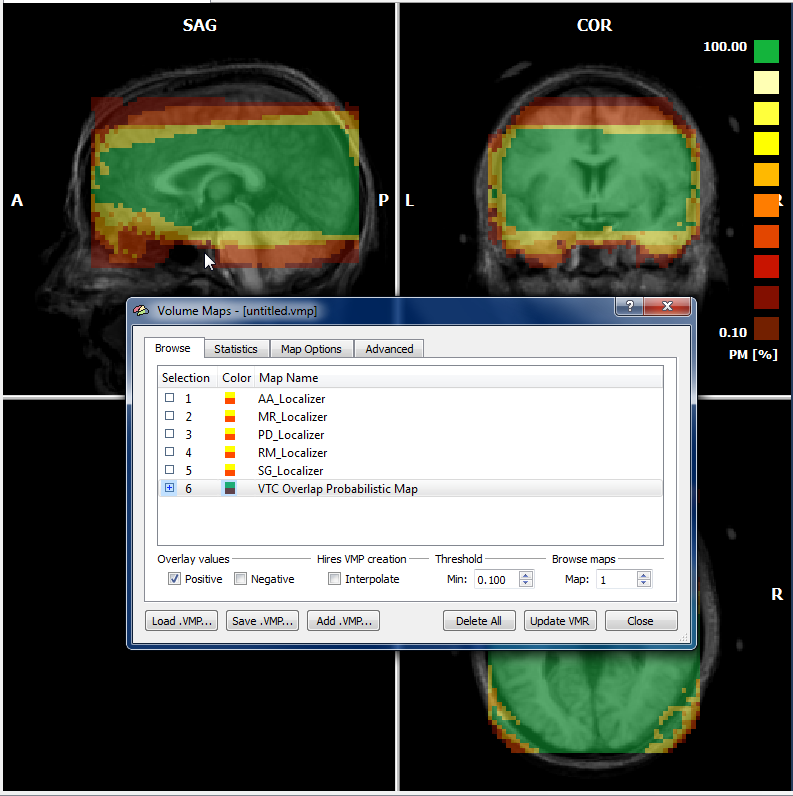
In the example probabilistic map one can clearly learn that large portions of the dorsal and frontal part of the brain would not be included in a multi-study GLM analysis (the example is from a study that was not interested in these regions). In order to find out "critical" scans that cover less than the desired brain region, one can look into the Volume Maps dialog. The dialog not only shows the probabilistic map (see last entry "VTC Overlap Probabilistic Map" but also a separate map for each included VTC file. Clicking through the list of VTC coverage maps, one can quickly identify problematc scans that can be eventually excluded from a group analysis.
Copyright © 2023 Rainer Goebel. All rights reserved.