BrainVoyager v23.0
Functional and Anatomical Preprocessing
This chapter describes background information of essential (pre-)processing routines and how they can be applied in BrainVoyager. While the descriptions focus on individual cases, the explanations in this chapter also serve as background documentation for the workflows executed via the Data Analysis Manager that calls the described routines repeatedly across runs, sessions and subjects.
A major goal of functional MRI (fMRI) measurements is the localization of the neural correlates of sensory, motor and cognitive processes. The term “brain mapping” is often used to refer to this goal of relating operations of the mind to specific areas and networks in the brain. Another major goal of fMRI studies is the detailed characterization of the response profile across experimental conditions for known regions-of-interest (ROIs). In this context, the aim of conducted studies is often not to map new functional brain regions (whole-brain analysis) but to characterize further how a known specialized brain area responds to (subtle) differences in experimental conditions of interest (ROI-based analysis). This chapter describes the first analysis steps that are usually conducted to reach these goals. The described analysis steps include data preprocessing such as head motion correction and filtering. In order to perform whole-brain analysis with the data from multiple subjects (group analyses), the data is usually transformed into a common, normalized, space (e.g. Talairach or MNI space), which involves the coregistration of functional and anatomical data sets, an anatomical brain normalization step and the transformation of functional data into the normalized space resulting in volume time course (VTC) data files. After completion of these steps, statistical single subject and group analyses can be performed.
Two Views on fMRI Data
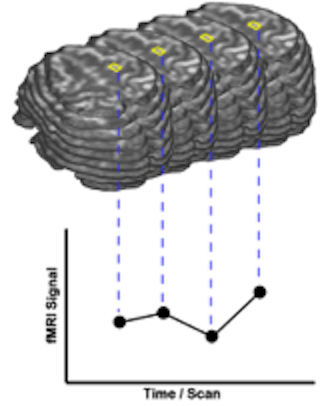
In order to better understand different fMRI data analysis steps, two different views on the recorded four-dimensional (3 x space and 1 x time) data sets are helpful. In one view, the 4D data is conceptualized as a sequence of functional volumes (3D images). This view is very useful to understand spatial analysis steps (see figure above, top part). During motion correction, for example, each functional volume of a run is aligned to a selected reference volume by adjusting rotation and translation parameters. The second view focuses on time courses of individual voxels (see figure above, bottom part). This second view helps to understand those preprocessing and statistical procedures, which process time courses of individual voxels. Most standard statistical analysis procedures including the General Linear Model (GLM) operate in this way. In a GLM analysis, for example, the data is processed "voxel-wise" (univariate) by fitting a model to the time course of each voxel independently or for the average signal time course in a region-of-interest. For multivariate data analysis approaches, consult the chapters multi-voxel pattern analysis, independent compoment analysis (ICA) and the help coming with the Granger causality (effective connectivity) plugin.
Copyright © 2023 Rainer Goebel. All rights reserved.