BrainVoyager v23.0
Probabilistic Maps and MPMs from POIs
Probabilistic maps (PMs) can be calculated from patches-of-interest (POIs) of corresponding cortical areas defined on meshes of a group of subjects who participated in cortex-based alignment. The POIs must be defined on the “SPH” versions of subject's cortex meshes. Furthermore, for each subject a respective SSM file (one for the left and one for the right hemisphere) must be available in order to allow transforming the POIs from subject space into common group space achieved during cortex-based alignment. The POIs in aligned space can then be used to calculate a probabilistic map testing the consistency of one or more regions across the vertices of the participating cortex meshes.
Since version 20.6 it is also possible to create maximum probability maps (MPMs) that assign a single area label to a vertex corresponding to the POI probabilistic map with the hightest (maximum) probability value. MPMs are especially useful to define boundaries between multiple overlapping probability maps (see example below). Since computed MPMs integrate all multi-subject source probability maps in one visualization of non-overlapping regions, they can be used for building and visualizing brain atlases.
Preparing Corresponding Multi-Subject POIs
While POIs could be trnasformed for individual subjects, it is recommended to integrate the POIs of different subjects into a common POI file as shown below. In this example, two POIs, "pFus_LH" (faces) and "CoS_LH" (places) have been defined on the SPH mesh of the left hemisphere of each subject (N=5 in this example). Using the Load and Add buttons, the two regions in respective POI files for single subjects can be integrated in a common group POI file.
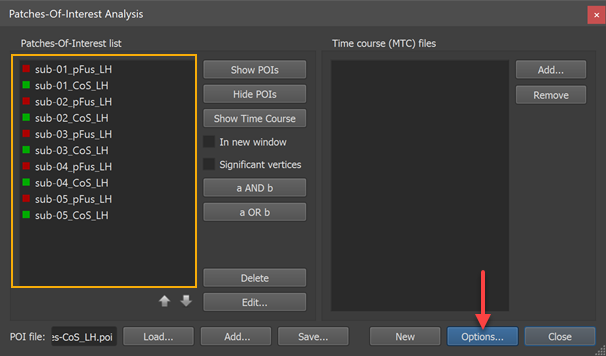
The POI names must uniquely identify the subject as well as the area. The names of the POIs must follow the naming convention "[Subject-ID]_[Region]" or "[Region]_[Subject-ID]"; you may choose one of these naming conventions but it must be applied consistently across subjects. While the "Region" name may contain underscore ("_") symbols, the subject identifier may not contain this symbol because it is used to split the subject identifier from the region name.
The screenshot above shows the Patches-Of-Interest Analysis dialog filled with 10 POIs. The naming convention is used with the subject identifier at the beginning of the POI name. In this example, the subject identifiers are "sub-01", "sub-02" ... "sub-05" and the region names are "pFUS_LH" and "CoS_LH". A separate probabilistic map can be calculated for each of these two regions across the five involved subjects.
Cortex-Based Alignment of POIs
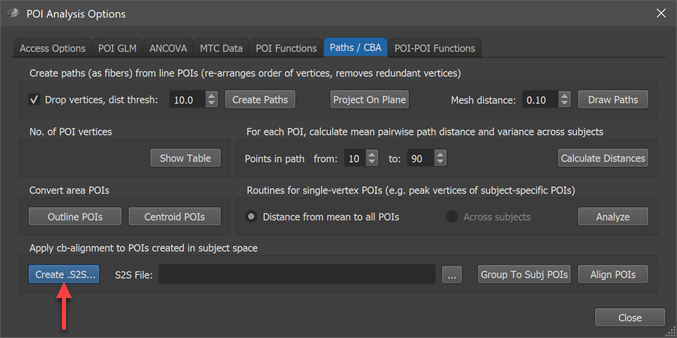
In order to apply the CBA step prior to calculation of a probabilistic map, the maps of participating subjects must be transformed using the subject's alignment (SSM) files, which are available as the result of cortex-based alignment. The alignment can be performed using the options in the Apply cb-alignment to POIs created in subject space field of the Paths / CBA tab in the POI Analysis Options dialog (see screenshot above). Use the Create .S2S button in that field to specify the association between subject IDs of the POIs and the CBA SSM files in the appearing Subject To CBA Data Assignment dialog. In case this association has been made earlier for the chosen subjects, the .S2S file can simply be reloaded using the Browse button on the right side of the S2S File text box in the Apply cb-alignment to POIs created in subject space field.
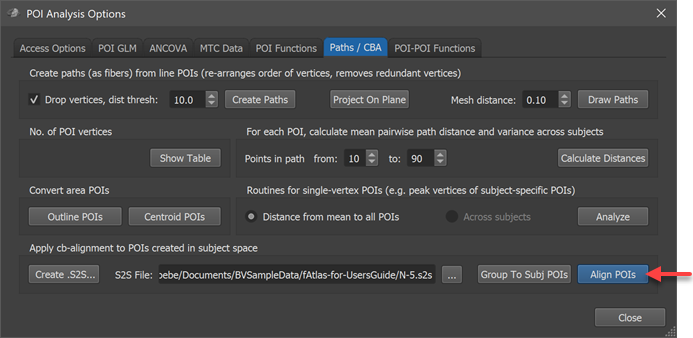
After having created or selected the proper S2S file, the POIs can be transformed from subject space into group-aligned space by clicking the Align POIs button (see screenshot above); for more details, check the topic CBA Transformation of POIs.
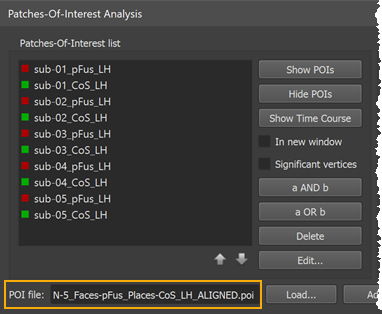
The transformed POIs are stored automatically in a file with the extension "_ALIGNED" (see screenshot above). Besides identifying the respective POI file versions, the availability of both the original and aligned POI files allows to create and compare probabilistic maps using cb-unaligned and cb-aligned POIs. Such a comparison is useful to estimate the gain achieved from cortex-based alignment.
Probabilistic Maps
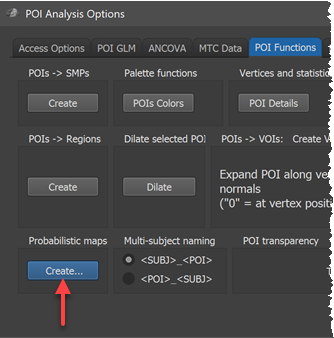
In order to calculate probability and maximum porbability maps (new in version 20.6), click the Create button in the Probabilistic maps field of the POI Functions tab of the POI Analysis Options dialog (see screenshot above). This invokes the POI Probabilistic Map Creation dialog shown below.
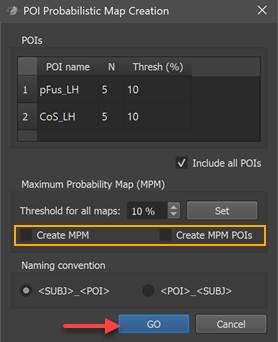
The POIs table in the dialog shows all available corresponding regions in the POI name column without the subject identifiers (in the example the two regions "pFus_LH" and "CoS_LH"). In case that subject names are shown, the naming convention does not fit; to adjust to the chosen naming convention, click the POI_SUBJ option in the Naming convention field and check whether the result is as expected.
For this first example, the Create MPM and Create MPM POIs options can be turned off since these functions are explained below with another example. In case that the Include all POIs option is turned on (default), all POIs will be included in subsequent calculations. If a specific subset of POIs should be used, one (or more) POIs in the POIs table can be selected and the Include all POIs option turned off. To start the procedure, the GO button can be clicked, which will calculate a separate probabilistic map for each selected POI. As default all calculated PMs will be overlaid on the loaded group cortex mesh, which can be a standard sphere or a folded group mesh (preferred). In the screenshot below, the folded group left hemisphere mesh of the 5 included subjects has been loaded as saved by CBA but it has been inflated to better visualize the resulting PMs. Individual probabilistic maps can be turned on or off using the Surface Maps dialog (right side below), that will appear automatically with an entry in the Maps list for each created probabilistic map. For the example data, all POIs have been included resulting in two probabilistic maps; note that the names of the maps contain the POI region name allowing to identify the maps in case that more than one map has been produced. In the screenshot below, the probabilistic maps for both areas ("pFus_LH" and "CoS_LH") have been selected and the overlay on the group mesh (left hemisphere) is shown on the left side before and after aligning the POIs using the respective SSM files.
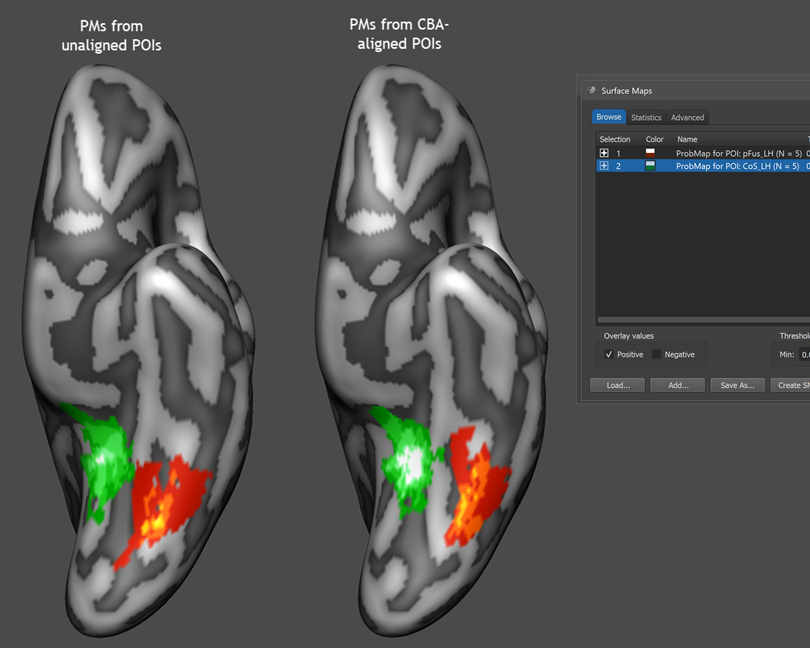
In order to improve the visualization of the probabilistic maps, an individual overlay look-up table (OLT) has been assigned for each map automatically. The used OLTs can be changed by using the Browse LUT button in the Confidence range field in the Statistics tab of the Surface Maps dialog. The screenshot above shows that CBA leads to a better overlap of functional regions, especially for the "places" area (CoS, PPA). The "faces" region (pFus) would likely be better aligned if CBA woudl include the mid-fusiform sulcus (MFS) as an explicit target region; this can be done using the functionally informed CBA approach.
Maximum Probability Maps
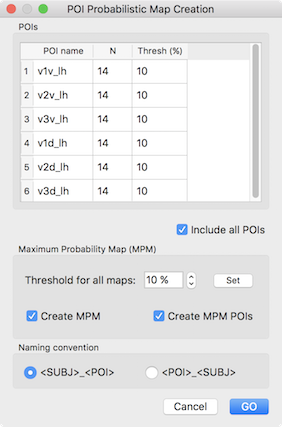
In order to demonstrate the value of maximum probability maps (MPMs), other example POIs are used below that exhibit overlap across subjects. The six included POIs (V1 - V3 in dorsal (indicated by letter "d") and ventral ("v") visual cortex of the left hemisphere) are the result of a standard retinotopic (pRF) mapping experiment. After loading the subject-specific POIs, the invoked POI Probabilistic Map Creation dialog shows the 6 areas in the POIs table (see snapshot below) indicating in the N column that each POI in the POI name column represents region data from 14 subjects. The third column Thresh (%) contains a minimum overlap (probability) threshold for vertices to be considered when calculating a MPM. Note that the threshold values can be specified for each POI separately by editing the entries of this column. For the usual case of setting the same probability threshold for all POIs, the Set button in the Maximum Probability Map field can be clicked after setting the desired value in the Threshold for all maps spin box.
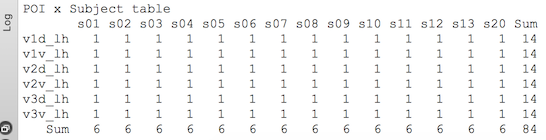
When invoking the POI Probabilistic Map Creation dialog, a "POI x Subject" table is also printed in the Log pane detailing which region is available for which subject (see snapshot below). The example output shows that the 6 areas are available for all included (14) subjects
For subsequent probability map calculation, all POIs are included in case that the Include all POIs option is checked (default: on). In case only a subset of POIs should be selected, turn off this option and select the desired POIs in the POI name column. To calculate the individual POI probability maps as well as the MPM, make sure that the Create MPM option is turned on (default: on). In order to also create a new set of non-overlapping MPM POIs, make sure that the Create MPM POIs option is checked (default: on). Clicking the GO button starts the requested processes. When calculations are completed with all output options turned on, three main results are produced, the individual POI probability maps, a maximum probability map and a set of non-overlapping MPM POIs.
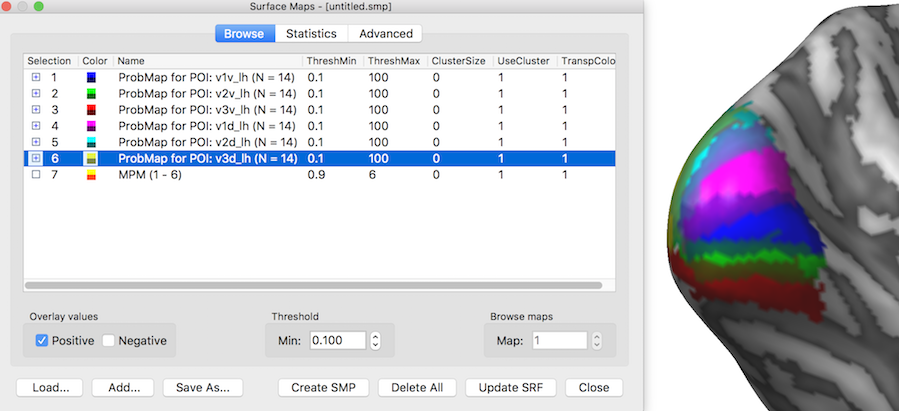
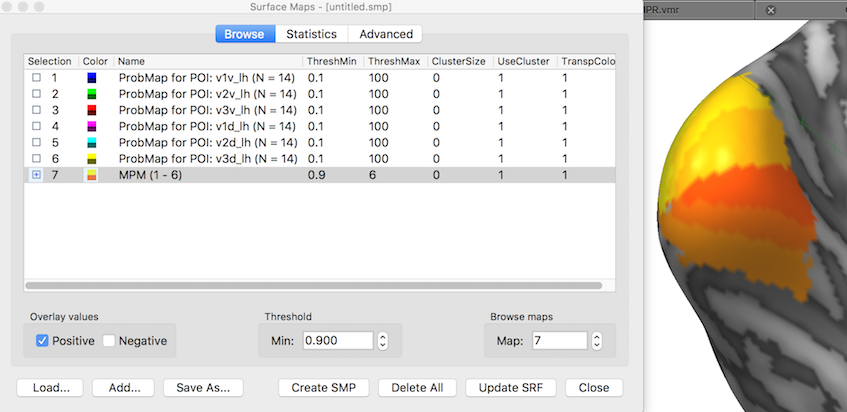
The snapshot above shows the POI probability maps and the MPM as they appear in the Surface Maps dialog. The inflated cortical surface on the right shows that the created six individual probability maps have been selected for display exhibiting some overlap around the occipital pole of the left hemisphere. When selecting, however, the MPM map (see snapshot below), non-overlapping map regions are shown as the result of the maximum calculation. Note that the MPM map is a "Preferences" map storing integral values (here from 1 to 6), i.e. it is not a statistical map. The colors of a preference map can be changed by loading a more expressive look-up table.
While the MPM surface map shows the separate POI regions, the program also converts them in separate non-overlapping POIs in case that the Create MPM POIs option was selected before clicking the GO button; in that case the original POIs list is cleared and filled with the created MPM POIs (see snapshot below). In order to keep the MPM POIs permanently, they need to be saved to disk using e.g. the suggested file name. The six created POIs are visualized below (POI labels have been turned off) and can now serve as a cortex-based aligned atlas of early visual areas.
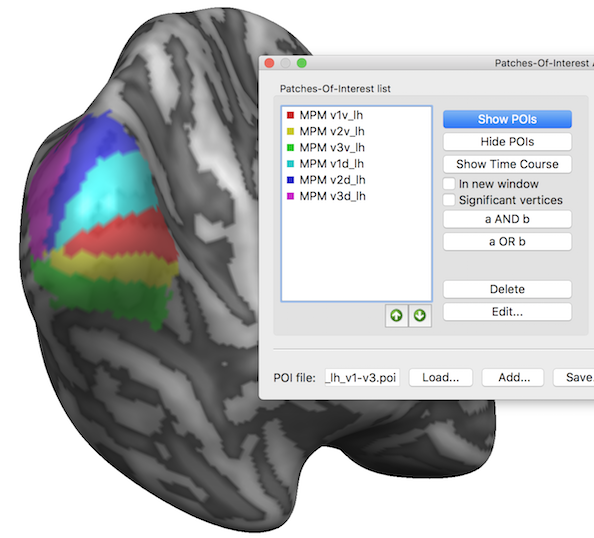
Note that the POI colors are assigned automatically by the program but it is often useful to change them using the Edit Patch-Of-Interest dialog that can be invoked using the Edit button in the main dialog.
Copyright © 2023 Rainer Goebel. All rights reserved.