BrainVoyager v23.0
Two-Factors Repeated Measures ANOVA
This model is suitable for many single-group fMRI designs. It consists of two within-subjects factors assuming that each subject has received all experimental conditions (repeated measures). In the following, it is first described how to use the ANCOVA dialog to run this model over all voxels (or vertices) in order to obtain RFX statistical maps and how main and interaction effects as well as specific contrasts can be tested. Then it is described how the ANCOVA dialog can be used to apply the two-way within-subjects factor model to any region-of-interest (ROI). The documentation in this section uses a simulated data set, which can be generated by running the Group Data Simulator plugin with the "Design_2W.gds" file (for details, see the online help of the plugin).
Providing a RFX-GLM as Input
In order to run an ANOVA analysis for this design, open the ANCOVA dialog from the Analysis menu. If you continue right away from a computed RFX-GLM, the beta values are already available and the design can be specified in the displayed Design tab. If no appropriate GLM data structure is available, select a previously calculated RFX-GLM file in the GLM / AVA tab. The program then automatically switches to the Design tab suggesting initially always a design with one within-subjects factor, which is listed in the Factor list. The levels of this "Within 1" factor are shown in the Level list containing all conditions (names of beta values) found in the provided GLM data.
Specification of the Design
Since this model contains two within-subjects factors, the Nr of witin-subjects factors entry has to be set to value "2". This will add an entry ("Within 2") to the Factor list. The program will also add the Assign Betas tab, which is used in designs for more than 1 within-subjects factor to assign conditions to factor-level combinations (see below). The name of the factor selected in the Factor list can be edited in the Factor name text box. For the example data, the name of the first factor (factor A) has been changed to "Sounds" and the name of the second factor (factor B) has been changed to "Images". The initial number of levels of the currently selected factor are shown in the Nr of levels field, and the names of the levels of the currently selected factor are shown in the Level list.
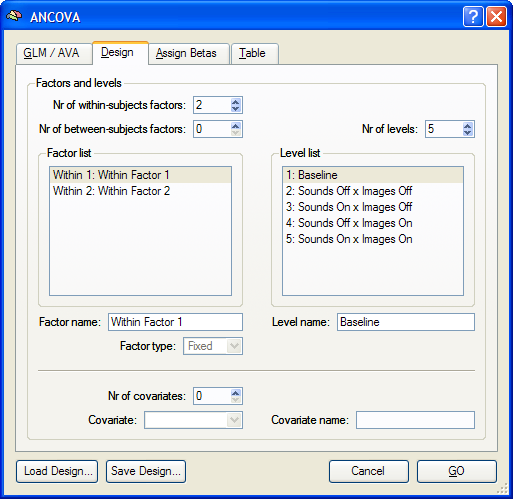
The factor-level combinations from the first-level GLM are listed as levels of factor A but have to be reformulated to represent a two-factorial design. Note that for subsequent RFX ANOVA modelling, multi-factorial within-subjects designs should always be modelled as a single-factor design at the first-level GLM analysis, although the Single Study GLM Options dialog offers automatic creation of single-run design matrices for two-factorial designs. If the design would be modelled as two-factorial already at the first level, the two-factorial ANOVA could not be used since the first level would estimate already main and interaction effects; in this case, the single-factor ANOVA could be used to perform RFX analysis of these explicitly modelled effects. If, however, a single-factor design (default, recommended) is used at the first level, the "flat" list of conditions - containing all factor-level combinations - can be modelled as a two-factorial ANOVA design.
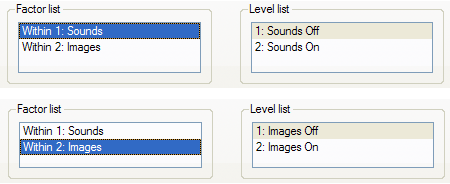
In the example data, factor "Sounds" and factor "Images" have two levels each. To define the levels of the first factor, it has to be selected in the Factor list ("Within 1: Sounds"). For the example design, the Nr of levels field has to be changed from value "5" to value "2", which will remove the conditions 3 - 5 from the initial Level list. To change the name of a level, select it in the Level list and then change its name in the Level name text box. For the example data, the name of level 1 has been renamed from "Baseline" to "Sounds Off", and the name of level 2 from "Sounds Off x Images Off" to "Sounds On" (see snapshot below). To define the levels of the second factor, it has to be selected in the Factor list ("Within 2: Images"). The number of levels for this factor needs not be changed since it matches the number of the default value of 2 levels. The name of level 1 has been renamed from "Level 1" to "Images Off", and the name of level 2 from "Level 2" to "Images On" (see snapshot below).
Assigning Factor-Level Combinations to GLM Conditions
The two-factorial design must be completed in the Assign Betas tab containing a factor crossing table. The levels of factor A are shown in the top row while the levels of factor B are shown in the left column of this table. Each cell of the table contains a drop-down box listing all conditions extracted from the RFX-GLM. In each cell, the correct condition from the condition list must be assigned to the corresponding factor-level combination (see snapshot below). Note that not all conditions from the list need to be linked to a factor-level combination, which can be helpful in case that the study used additional (control) conditions next to the conditions belonging to the two-factorial design. In the example data, the "Baseline" condition is not assigned to a factor-level combination.
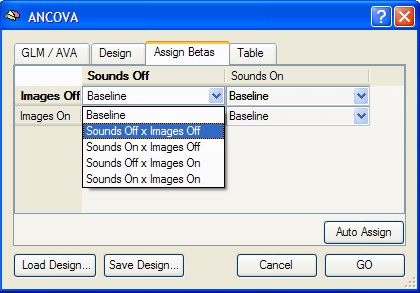
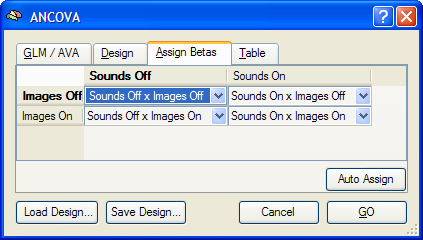
The assignment of GLM conditions to factor-level combinations can be performed manually by selecting the correct condition in the drop-down box for each table cell. It can also be performed automatically by clicking the Auto Assign button. The latter approach works correctly only if 1) the names of the conditions in the GLM (first level) follow the naming convention "<factor A level> x <factor B level>" or "<factor B level> x <factor A level>", and 2) the level names for factor A and B are identical to the names specified in the Design tab. Since these conditions are fulfilled for the example case, the assignment can be performed automatically by clicking the Auto Assign button leading to the result shown below. The completed design can be saved to disk using the Save Design button (e.g. as "CrossModalExperiment.ads" for the example data).
To run the two-factors ANOVA, click the GO button. The resulting ANOVA results for each voxel are stored in the AVA file specified in the GLM / AVA tab.
Testing Effects and Contrasts
The two-factorial within-subjects ANOVA model allows testing overall main effects for each factor, an interaction effect between the two factors as well as specific contrasts. After calculating the model, an F map is shown as default testing significance of factor A (factor "Sounds"). Other tests can be selected in the Overlay RFX ANCOVA Tests dialog (see snapshot below), which can be invoked by selecting menu entry Overlay RFX ANCOVA in the in the Analysis menu. If this dialog is called and no AVA file is available, most options are disabled. In that case, the Load AVA button can be used to select the AVA file. The program tries also to load the original RFX-GLM file from which the AVA file has been calculated. While this GLM file is not necessary for overlaying ANOVA tests, it allows to show the Voxel Beta Plot dialog with the data (beta values) at the voxel under the mouse cursor.
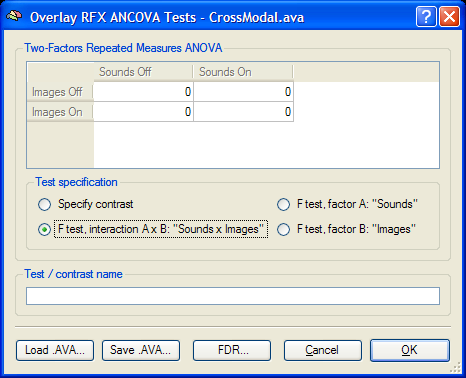
The Overlay RFX ANCOVA Tests dialog (see snapshot above) contains a contrast table showing the levels of factor A (within-subjects factor "Sounds" in the example design) in the top row and the levels of factor B (within-subjects factor "Images") in the left column. The entries in the cells of the table can be changed to test specific contrasts comparing specific factor-level combinations. The options in the Test specification field allow to select the type of test, which can be a specific contrast (Specify contrast option, resulting in a t map), an F test for factor A (F test, factor A option), an F test for factor B (F test, factor B option) or an F test for the interaction between the two factors (F test, interaction A x B option). If the Specify contrast option has been selected, the entries in the cells of the contrast table can be changed from "0" to "+1", "-1" and "0" by clicking repeatedly on a chosen cell. Double-clicking a cell allows entering a numerical value directly. As default, multiple comparisons correction will be turned off for the resulting statistical (F or t) map but can be turned on using the FDR button. Clicking the OK button will calculate and overlay the selected test as a statistical map on the underlying anatomical data set (VMR or SRF). In the snapshot above, the interaction F test has been selected. The resulting F map shows a strong effect in the ROI "VOI 1" but not in the ROI "VOI 2", which is evident when inspecting the respective voxel beta plots (see below).
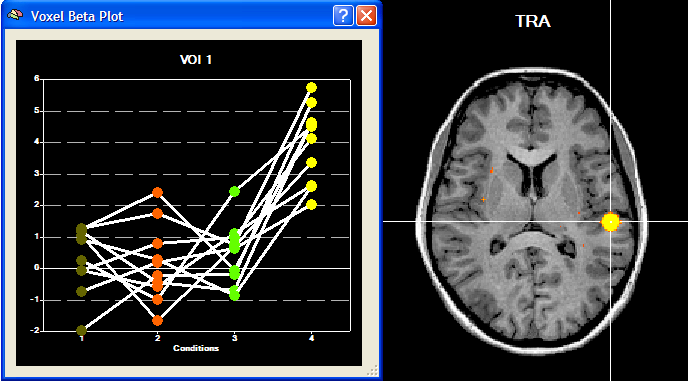
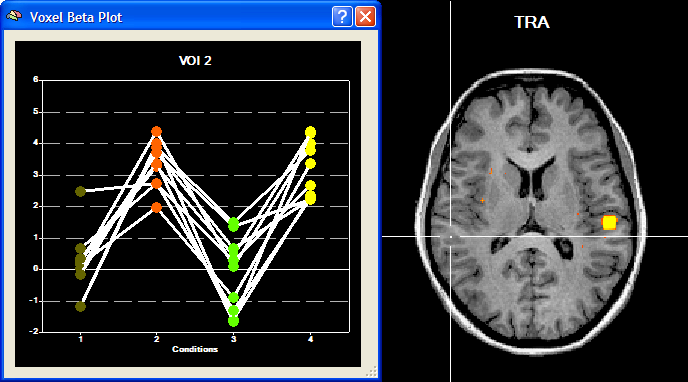
The Voxel Beta Plot of "VOI 2" indicates only a main effect for factor "Sounds" but no main effect for factor "Images" and no interaction effect. The lack of a significant interaction effect is evident since the difference between column 2 ("Sounds On x Images Off") and column 1 ("Sounds Off x Images Off") is of the same magnitude as the difference between column 4 ("Sounds On x Images On") and column 3 ("Sounds Off x Images On"). Besides main effects of "Sounds" and "Images", the Voxel Beta Plot of "VOI 1" indicates a strong interaction effect since the condition "Sounds On x Images On" (column 4) deviates substantially from the response level of the other three conditions. These observations are confirmed when specifying the respective tests in the Overlay RFX ANCOVA Tests dialog.
Testing the Model for ROI Time Courses
Besides calculating statistical ANOVA maps (VMPs or SMPs), it is possible to run the ANOVA analysis for any region-of-interest (ROI) providing detailled numerical output. As a prerequisite, VOIs have to be available, which can be loaded from disk or directly defined from functional or anatomical data. After functionally defining the two VOIs "VOI 1" and "VOI 2" for the sample data, the ANCOVA dialog can be invoked from the VOI Analysis Options dialog, which itself can be called from the Volume-Of-Interest Analysis dialog. Before calling the ANCOVA dialog, the same multi-subject design matrix file (e.g. "CrossModalExperiment.mdm") used to calculate the RFX-GLM has to be selected in the Design matrix file text box of the GLM Options tab. After the MDM file has been specified, a VOI can be selected in the VOI list of the VOI GLM tab. The ANCOVA dialog can then be launched from the VOI GLM tab by clicking the ANCOVA button in the VOI RFX analysis field. At that time, the specified MDM design matrix file is used to run a first-level RFX-GLM over the VOI time courses of all subjects in order to obtain VOI beta values as input for the second-level ANOVA analysis. The ANCOVA dialog will show two tabs, the Design and the Table tab. Since the default design corresponds to a one within-subjects factor model, the design has to be changed in the same way as described above. A more convenient way is to reload the previously saved design specification (e.g. "CrossModalExperiment.ads") using the Load Design button. When the second factor has been added, the Assign Betas tab will be made available allowing to assign GLM conditions (beta values) to factor-level combinations. When loading the design from disk, the program switches automatically to the Assign Betas tab and runs the automatic assignment routine. It should be checked that the assignment is made correctly (for details about the rules for automatic assingment, see above).
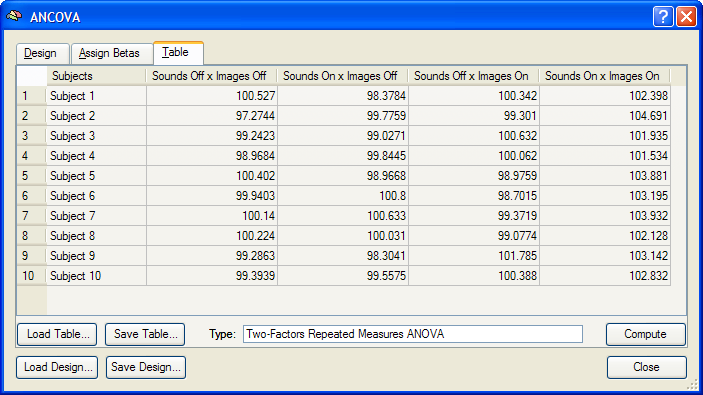
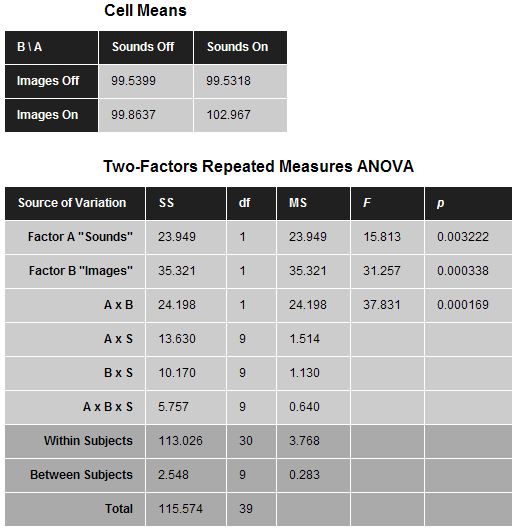
For the selected ROI ("VOI 1" in the snapshot above), the Table tab contains a subjects condition values table with the estimated effects (beta values) for each subject. The 2x2 factor-levels are shown in the upper row of the table. Each row contains the data from one subject. Using the data in the table, the specified two-factors ANOVA model can be calculated by clicking the Compute button. The results are presented in tabular form in three sections of a HTML document (see snapshot below). The first section (not shown) defines information about the factors and respective levels. The second section, "Cell Means", depicts a two-way table containing the mean values for all factor-level combinations (mean condition effects averaged across subjects). The third section shows the ANOVA table. The most important information of this table are the first three F tests indicating whether there is a significant main effect of factor A ("Sounds"), factor B ("Images") and a significant interaction effect (A x B). As was already evident from inspection of the Voxel Beta Plot of a voxel of ROI "VOI 1", all three effects are highly significant in this region.
Validation of Calculations
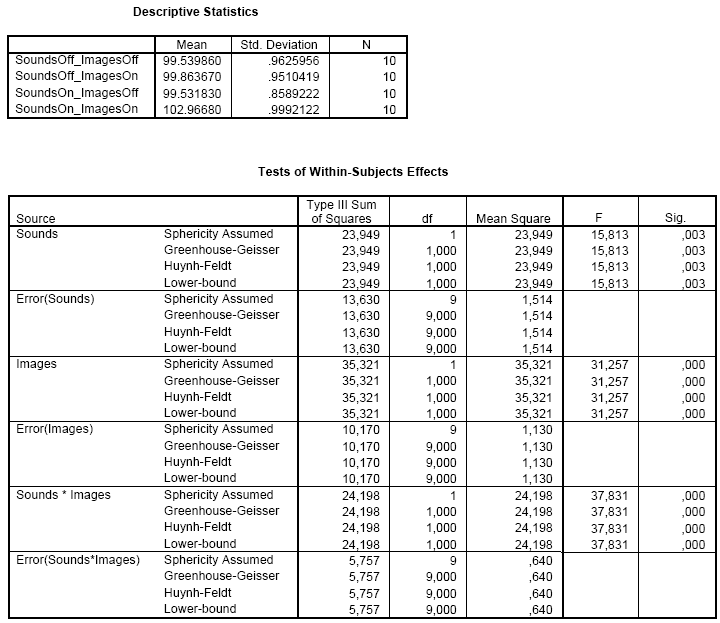
The VOI data of the table in the Table tab of the ANCOVA dialog can be saved to disk using the Save Table button allowing further analysis, if desired. During development of the ANCOVA module, the saved table data has been analyzed in SPSS 15 to test that the implemented calculations in BrainVoyager are performed correctly. As the snapshot below shows, the results from the SPSS analysis are identical to the ones obtained in BrainVoyager. The "Descriptive Statistics" shows that the calculated mean values correspond to the values in section 2 ("Cell Means") of the BrainVoyager output. The SPSS results in section "Tests of Within-Subjects Effects" are identical to the BrainVoyager results obtained for factor "Sounds", factor "Images", and the interaction "Sounds x Images". This holds also true for the associated error terms.
Copyright © 2023 Rainer Goebel. All rights reserved.