BrainVoyager v23.0
Probabilistic Maps and MPMs from VOIs
Probabilistic maps can be calculated from Volumes-Of-Interest (VOIs) defined for each subject in normalized (Talairach or MNI152) space. The VOIs in normalized space can then be used to calculate a probabilistic map testing the consistency of one or more regions across subjects. The used corresponding regions may be functionally defined areas, but may also be derived from other information, e.g. macro-anatomical areas.
Since version 20.6 it is also possible to create maximum probability maps (MPMs) that assign a single area label to a voxel corresponding to the map with the hightest (maximum) probability value. MPMs are especially useful to define boundaries between multiple overlapping probability maps (see example below). Since computed MPMs integrate all multi-subject source probability maps in one visualization of non-overlapping regions, they can be used for building and visualizing brain atlases.
Preparing Corresponding Multi-Subject VOIs
In order to use the probabilistic map tool, the VOIs must be defined for one or more areas for each subject participating in a group analysis. The VOI names must uniquely identify the subject as well as the area. The names of the VOIs must follow the naming convention "[Subject-ID]_[Region]" or "[Region]_[Subject-ID]"; you may choose one of these naming conventions but it must be applied consistently across subjects. While the "Region" name may contain underscore ("_") symbols, the subject identifier may not contain this symbol because it is used to split the subject identifier from the region name.
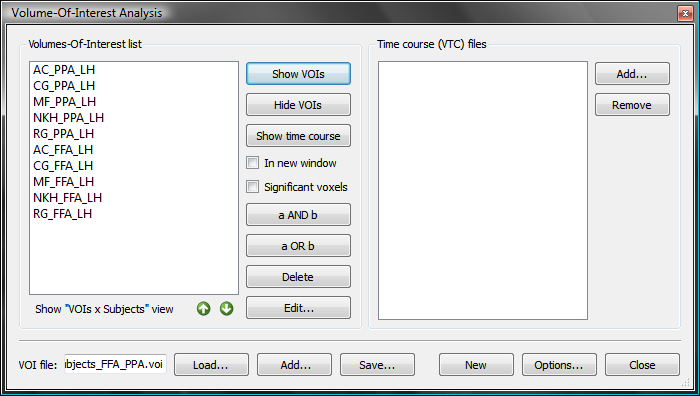
The snapshot above shows the Volume-Of-Interest Analysis dialog filled with 10 VOIs. The naming convention is used with the subject identifier at the beginning of the VOI name. An explicit representation of the extracted region and subject names can be obtained by clicking the Show VOIs x Subjects view button. In this example, the subject identifiers are "AC", "CG", "MF", "NKH" and "RG" and the region names are "FFA_LH" and "PPA_LH". A separate probabilistic map can be calculated for each of these two regions across the five involved subjects.
Probabilistic Maps
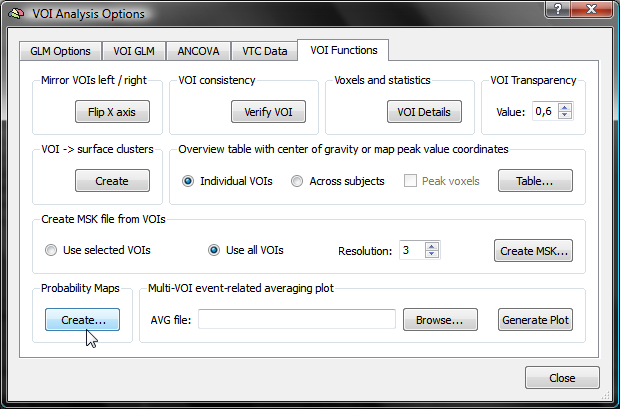
In order to calculate probability and maximum porbability maps (new in version 20.6), click the Create button in the Probabilistic maps field of the VOI Functions tab of the VOI Analysis Options dialog (see snapshot above). This invokes the VOI Probabilistic Map Creation dialog shown below.
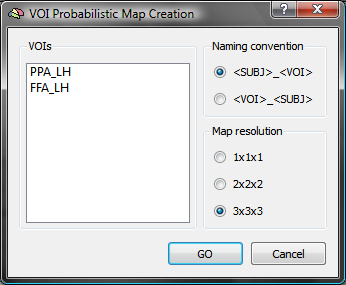
The VOIs list in the dialog shows all available corresponding regions without the subject identifiers (in the example the two regions "FFA_LH" and "PPA_LH"). In case that subject names are shown, the naming convention does not match; to adjust to the chosen naming convention, click the VOI_SUBJ option in the Naming convention field. The calculated probabilistic map will be stored in a native-resolution volume map with the same resolution as the hosting VMR (1x1x1 relative resolution).
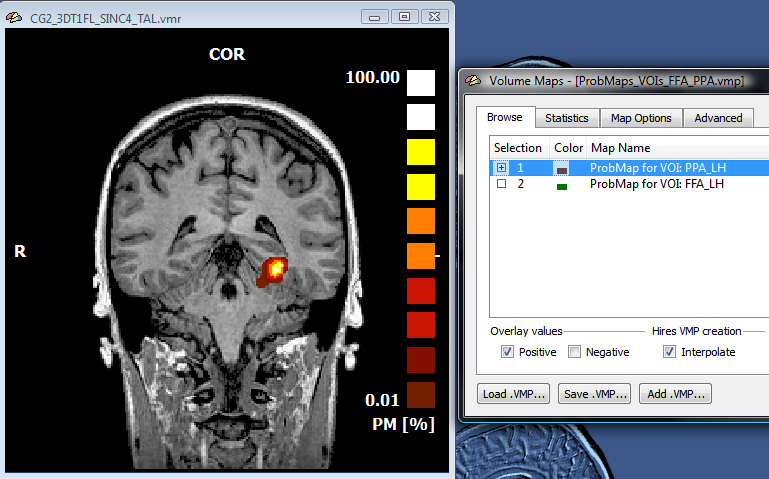
After selecting one (or more) VOIs in the VOIs list, click the GO button, which will calculate a separate probabilistic map for each selected VOI. To select which calculated probabilistic map should be overlaid on the anatomical VMR data set, open the Volume Maps dialog, which will show an entry in the Maps list for each created probabilistic map. For the example data, both VOIs had been selected resulting in two probabilistic maps; note that the names of the maps contain the VOI name allowing to identify the maps in case that more than one has been calculated. In the snapshot below, the first probabilistic map (for area "PPA_LH") has been selected and the overlay on a coronal slice is shown on the left side.
More than one map can be selected for overlay at the same time but this requires switching to the Multiple selections option in the Map Selection field of the Advanced tab of the dialog. Furthermore, an individual overlay look-up table (OLT) may be assigned for each map using the Browse LUT button in the Value and color ranges field of the Statistics tab of the Volume Maps dialog.
Maximum Probability Maps
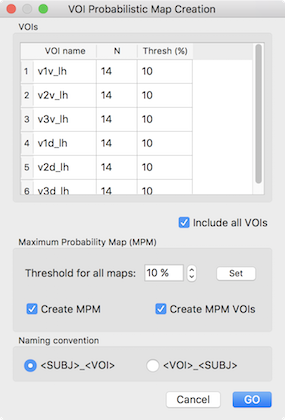
In order to demonstrate the value of maximum probability maps (MPMs), other example VOIs are used below that exhibit overlap across subjects. The six included VOIs (V1 - V3 in dorsal (indicated by letter "d") and ventral ("v") visual cortex of the left hemisphere) are the result of a standard retinotopic (pRF) mapping experiment. After loading the subject-specific VOIs, the invoked VOI Probabilistic Map Creation dialog shows the 6 areas in the VOIs table (see snapshot below) indicating in the N column that each VOI in the VOI name column represents region data from 14 subjects. The third column Thresh (%) contains a minimum overlap (probability) threshold for voxels to be considered when calculating a MPM. Note that the threshold values can be specified for each VOI separately by editing the entries of this column. For the usual case of setting the same probability threshold for all VOIs, the Set button in the Maximum Probability Map field can be clicked after setting the desired value in the Threshold for all maps spin box.
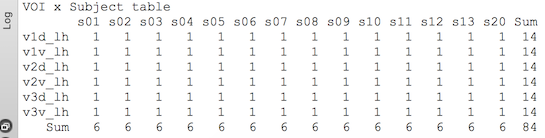
When invoking the VOI Probabilistic Map Creation dialog, a "VOI x Subject" table is also printed in the Log pane detailing which region is available for which subject (see snapshot below). The example output shows that the 6 areas are available for all included (14) subjects.
For subsequent probability map calculation, all VOIs are included in case that the Include all VOIs option is checked (default: on). In case only a subset of VOIs should be selected, turn off this option and select the desired VOIs in the VOI name column. To calculate the individual VOI probability maps as well as the MPM, make sure that the Create MPM option is turned on (default: on). In order to also create a new set of non-overlapping MPM VOIs, make sure that the Create MPM VOIs option is checked (default: on). Note that the resolution of the probability maps relative to the resolution of the VMR / source VOIs will be 1x1x1, i.e. the probability maps and the created VOIs will be in the same resolution as the hosting VMR data set (usually 1 mm Talairch or MNI iso-voxel). Clicking the GO button will start the requested processes. When calculations are completed with all output options turned on, three main results are produced, the individual VOI probability maps, a maximum probability map and a set of non-overlapping MPM VOIs.
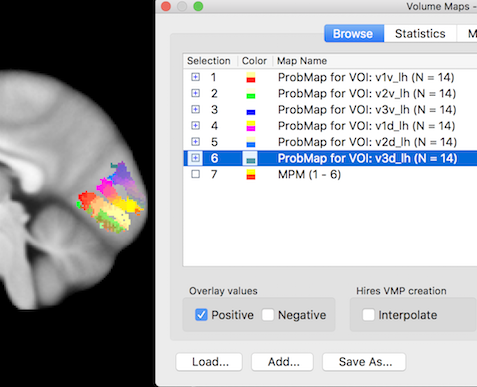
The snapshot above shows the VOI probability maps and the MPM as they appear in the Volume Maps dialog. The visualization on the right shows that the created six individual probability maps have been selected for display exhibiting some overlap around the calcarine sulcus in the occipital lobe (left hemisphere). When selecting, however, the MPM map (see snapshot below), non-overlapping map regions are shown as the result of the maximum calculation. Note that the MPM map is a "Preferences" map storing qualitative integral values (here from 1 to 6), i.e. it is not a statistical map. The colors of a preference map can be changed by loading a more expressive look-up table.
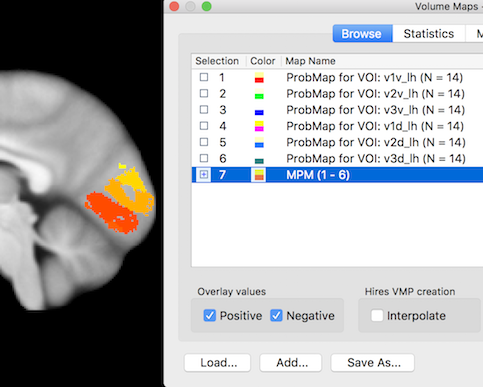
While the MPM volume map shows the separate VOI regions, the program also converts them in separate non-overlapping VOIs in case that the Create MPM VOIs option was selected before starting the calculation; in that case the original VOIs list is cleared and filled with the created MPM VOIs (see snapshot below). In order to keep the MPM VOIs permanently, they need to be saved to disk using e.g. the suggested file name. The six created MPM VOIs are visualized below and can now serve as a volume-based atlas of early visual areas.
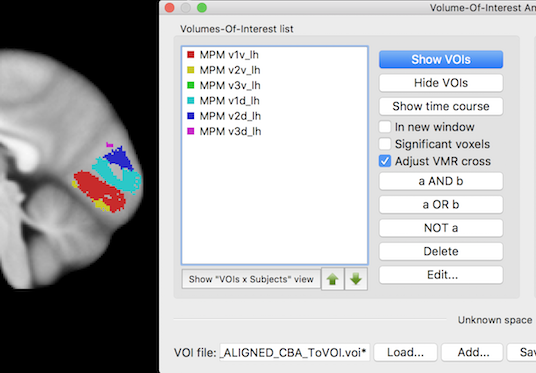
Note that the VOI colors are assigned automatically by the program but it is often useful to change them using the Edit Volume-Of-Interest dialog that can be invoked using the Edit button in the main dialog.
Copyright © 2023 Rainer Goebel. All rights reserved.