BrainVoyager v23.0
EEG/MEG Channel Data Preparation and Preprocessing
The EEG/MEG signal projection from the channel to the source space requires that channel data are preliminary organized as averaged channel data (ACT), single-trial channel data (STD) and, if needed, time-frequency data (TFD). That means that, with or without final averaging or time-frequency transformation, single trials have to be extracted from the continuous channel data (CTC).
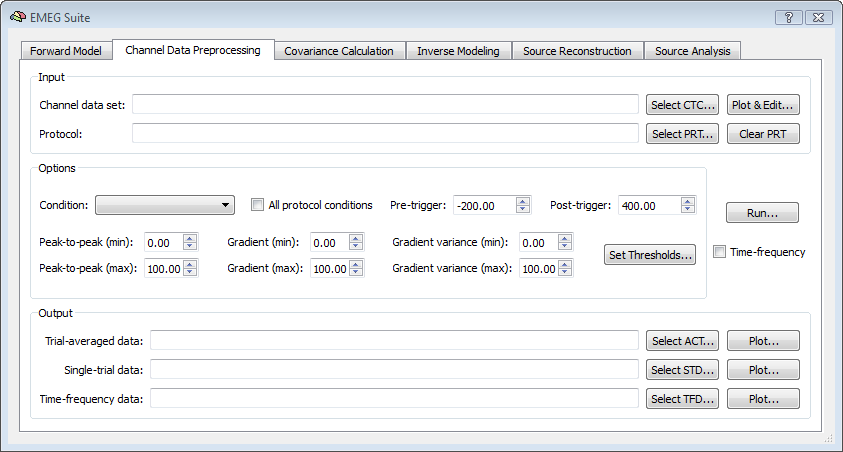
The second tab of the EMEG suite allows performing the channel-level data preparation and preprocessing which consists in creating the ACT, STD and TFD files from the CTC and the PRT files. To this purpose, continuous EEG/MEG channel time-course (CTC) data are combined with trigger information as is stored in protocol files (PRT) for epoching, averaging and time-frequency transformations.
Note: ACT, STD and TFD data files will be also generated even if a single continous data segment or block, or the entire CTC, is to be analyzed as a single trial (typically for spectral and time-frequency analysis, see below). However in this special case, the ACT file will contain the average power spectral densitry (PSD) of the data segment and the STD and TFD files will contain just one trial.
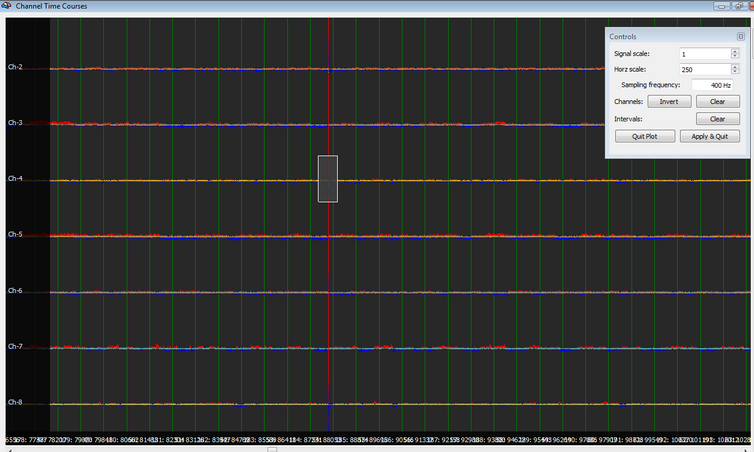
Before running the tool, CTC data sets can be visually inspected in combination with trigger information (if available from the specified PRT file) and edited using the EMEG data editor. This step is recommended for several reasons: first, it is possible to inspect all channel time-courses and eventually identify and remove bad channels. Second, one or more intervals containing artifacts can be removed manually, independently from the trigger information. The example below shows a typical "spike" artifacts in a data set which could be removed, e. g., by simply removing a tiny interval of data by ctrl-shif clicking and dragging the mouse, and finally applying this selection.
During preparation, all extracted epochs (single trials) are scanned for artifacts and selectively rejected before averaging and time-frequency transformations. Thresholds can be suitable set to exclude "bad" trials from the analysis. This is achieved by extracting and characterizing all single trials from the CTC file for the selected condition. Each trial is defined according to the pre- and post-trigger times with respect to the onset of each protocol condition and three values are used to characterize each trial at each channel: the peak-to-peak (i.e. the difference between the maximum and the minimum amplitude for a given trial and channel), the gradient (i.e. the largest amplitude difference between two neighboring time samples within a trial for a given channel) and the variance of the gradient within a trial for a given channel (this criterion is used to detect epochs during which a channel dropped out).
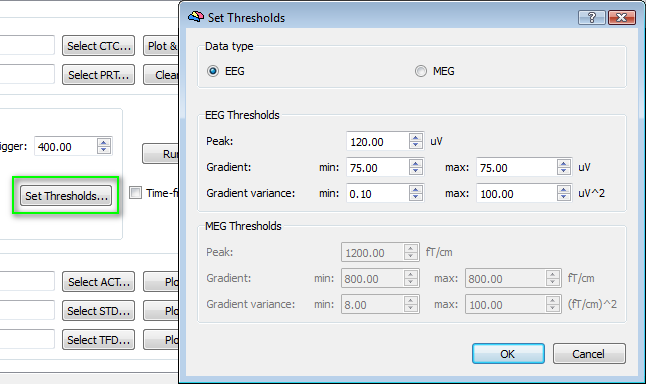
There are two ways to modify the artifact thresholds for trial rejection, an absolute and relative way. Depending on the modality, there are absolute pre-fixed thresholds for the trial values. Using the Set Threshold button, it is possible to switch modality and change these thresholds. These thresholds are handled with their physical dimensions. As an alternative, a minimum and maximum threshold can be changed in the main dialog in terms of relative percentages of the absolute thresholds. For instance, assuming that the EEG modality is used, with a peak threshold set at 120 uV (default), adjusting the peak-to-peak (min) at 10% and the peak-to-peak (max) at 80% ensures that a trial is rejected if the peak-to-peak value is below 12 uV or if the peak-to-peak value is above 96 uV. Please note: while both min and max peak-to-peak relative thresholds are referred to one unique absolute threshold value, the gradient and gradient variance min and max relative thresholds are referred to separate absolute thresholds.
Time-Frequency Analysis
Besides the generation of the averaged data set (ACT) and the corresponding single-trial data set (STD), a time-frequency representation can also be generated using the short-time Fourier transform (STFT) approach.
Short-time Fourier transform (STFT) is a method which applies a short time window to the signal and performs a series of Fourier transforms as the window slides across an epoch or a data segment. For a discrete-time signal x[n], the STFT is given by the equation:
where w(t) is the window function centered around zero:
The discrete-time index m is sometimes called the "slow" time index when compared to the time index n. The time-resolution of the STFT (in ms) defines the span of m for a given sampling frequency of the input data sets. Similarly, the time window duration (more conveniently expressed in s) determines the discrete duration (N) for a given sampling frequency. Since the STFT is performed using the Fast Fourier Transform (FFT), the frequency variable w is also quantized as w=2pk/Nfft, Nfft being the number of points of the FFT, which corresponds to the first power of 2 higher than N, eventually multiplied by the FFT increasing factor (default 1).
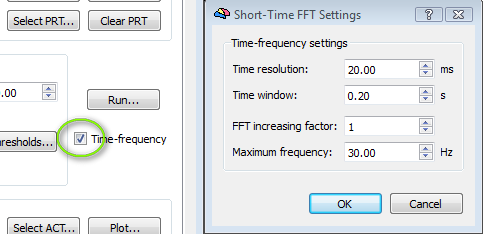
The time resolution (in ms), the time window duration (in s), the FFT increasing factor and the maximum frequency to be included in the TFD representation can be set by the user upon checking the time-frequency check box.
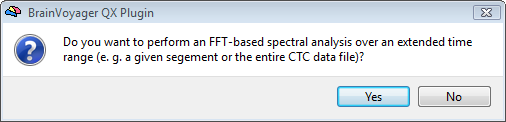
Important note (1): When running the tool with "Time-frequency" activated there are two different ways the FFT window can be applied to data. As default, in the presence of a protocol file specified in this tab of dialog, all trials corresponding to the selected condition and the specified epoch definition (i. e. from pre to post ms around each trigger) are extracted from the CTC and, for all non-rejected trials, the window is applied to each single trial separately. In contrast, if no protocol is supplied (or if explicitly requested by the user), the window can be moved to one single trial only consisting of either the entire CTC (if no protocol is specified) or a predefined segment of it (defined from the first trigger of the specified protocol). In this case, however, no trial-based artifact rejection will occur. In fact, the artifact scanning will be not applied to the unique single trial (in which case a rejection would imply a reject of the entire data set) but directly applied to all individual FFT windows. In single-segment mode, the artifactual window will not contribute to the average PSD (stored in ACT) but will be still visible in the TFD data (see below). In both single-trial and single-segment cases, however, a rejection of 75% of the trials or more will automatically stop the calculations.
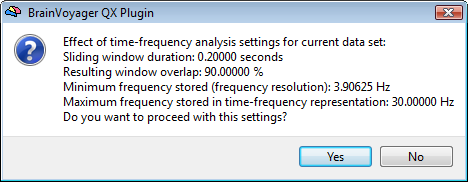
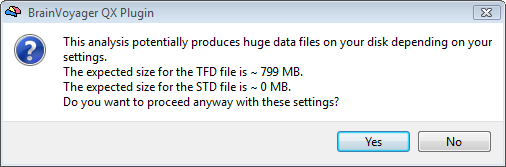
Important note (2): Whe running the tool in "Time-frequency" mode it is crucially important to further check the ST-FFT settings. A summary of the effects of this settings is therefore shown to the user prior to start real calculations, together with the request to verify and accept them. This is particularly important when long data segments should prepared for the analysis because possible wrong settings of the time-frequency may easily generate huge data files and start endless calculations. In addition, after artifact scanning and prior to time-frequency calculations, one more warning message may appear if the resulting TFD or STD data files exceed 30 MB (here the threshold for warning is kept purposely low because knowning in advance the size of the files may be desired in general by the user even if it is possible to proceed without problems with these settings).
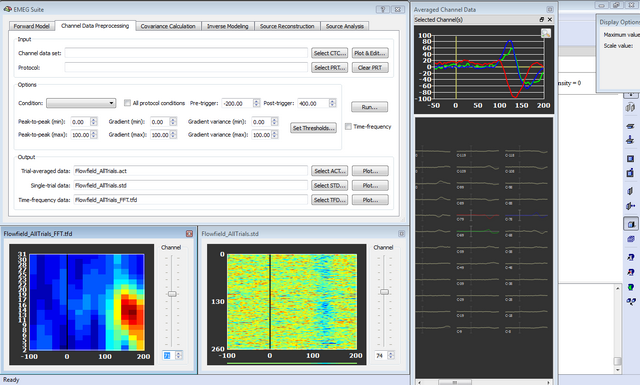
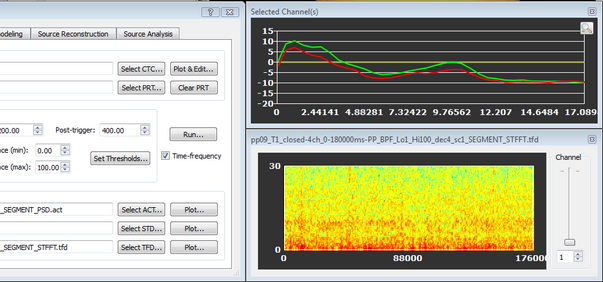
The final results of the channel data preprocessing can be plotted in the same tab. When working in single-trial mode, the ACT will consist of average trigger-related reponses (i. e. ERP or ERF). The STD plot will produce time vs trial images and the TFD plot will produce time vs frequency magnitude plot of the trial-averaged baseline (prestimulus)-normalized time-frequency representations. In single-segment mode the ACT will contain the average PSD (vs frequency) and the TFD plot will contain the magnitude of the (non-averaged and non-normalized) time vs frequency representation. Example results are shown below for the two modality of operation.
Example of single-trial results:
Example of single-segment results:
Reference
Michael R. Portoff, "Time-frequency representation of digital signals and systems based on Short-time Fourier analysis", IEEE Trans. on Acoustics, speech, and signal processing, vol. ASSP-28, No. 1, February 1980;
Copyright © 2023 Fabrizio Esposito and Rainer Goebel. All rights reserved.