BrainVoyager QX v2.8
Creating VTC Masks from Statistical Maps
A VTC mask is a 3D maks with a voxel resolution of VTC and GLM data structures, which is typically lower than the resolution of VMR data sets (for details, see below). VTC masks are typically used to limit statistical analyses to a desired sub volume: All voxels in the mask are included in the analysis, while all voxels outside the mask are excluded from analysis. An important benefit of masked analysis is a reduction of the multiple comparison problem since less voxels are included than in a standard analysis. Since with less voxels also less statistical tests are executed, masked analyses allow for less conservative thresholds than unmasked analyses.
A 3D mask can be created in several ways based on anatomical or functional data. We use the term "cortex-based analysis" for a particularly important example of masked analysis in which the included functional data is restricted to the voxels in the cortex. The respective grey matter voxels are obtained during a standard segmentation procedure as described elsewhere.
Here we describe how a mask can be created from a thresholded map (VMP), which can be derived, for example, by overlaying a GLM contrast. With the obtained mask it is possible to run a specific statistical analysis only over those voxels contained in the mask, i.e. which were determined as significant in a previous statistical test. Note that the logic of sequential testing should be non-circular from a statistical point of view. It is recommended to use a different data set to obtain the mask for the subsequent test. If two data sets are used, you may use the exact contrast for mask definition as subsequently for the main test. If you use the same data set for mask definition as well as for the subsequent test, you should use orthogonal contrasts to avoid circularity (see example below).
The Direct Approach
The significant (above-threshold) voxels of a statistical 3D map (VMP) can be converted into a mask file using the Create VTC Mask From Map tool that can be invoked from the Create VTC Mask From Map item in the Options menu (since QX v1.5). This tool determines all significant voxels of the current VMP and saves them in a mask file with the extension ".MSK". The default resolution of voxels in the mask is "3" but can be changed if necessary (see section below for details). To use the mask file subsequently as a constraint, it has to be specified in the dialogs running statistical tests. To use the mask file, for example, for a single-study GLM, select it in the Mask-based (i.e. cortex-based) analysis field of the Masking functions tab of the Single Study GLM Options dialog. To use the mask file for a multi-study GLM, select the mask file in the Mask-based (i.e. cortex-based) analysis field of the Multi-Study GLM Options dialog.
Voxel resolution in mask files. Note that the resolution of the voxels in the mask file will be in the default resolution of VTCs and GLMs, which is "3". In a resolution of "3" one mask voxel corresponds to a cube of 3x3x3 VMR voxels (which corresponds to 27 mm3 in case of a standard VMR with a 1 mm resolution). You may change the resolution of your mask file to "2" or "1" but this is only recommended if you intend to run your functional analysis over VTC data with a corresponding resolution. For more details, see ["Create VTC" chapter]. For better visualization, the 3x3x3 voxels of a GLM contrast are interpolated to the 1x1x1 voxels of the VMR on which the map is shown. In order to see the voxels in the original GLM resolution, you may turn off the Trilinear interpolation option in the GLM -> VMP resolution field of the Overlay GLM Options dialog. If you then overlay the same GLM contrast again, you will see a map with the true (i.e. 3x3x3) voxel resolution. This view identifies precisely the voxels defining the mask.
The VOI Approach
A mask can also be created from any set of defined Volumes-Of-Interest (VOIs). If we first create VOIs from a statistical map, we can then click the Create .MSK button in the Create MSK file from VOIs field of the VOI Analysis Options dialog to convert them into a mask. This approach involves more steps, but it offers a more fine-grained control over the content of the mask. It is, for example, possible to create the mask from any subset of VOIs or to integrate the map VOIs with any other anatomically or functionally created VOIs.
The creation of a mask from statistical tests with the VOI approach procedes in these stages:
- Create a VMP as the result of a statistical test, i.e. by overlaying a GLM contrast
- Convert the significant voxels of the VMP into a set of VOIs
- Edit the VOIs if desired
- Create the mask from all VOIs or from a subset
- Specify the created mask file as a sub volume restriction in a subsequent functional analysis
To convert a thresholded VMP into a set of VOIs, use the Create Volumes-Of-Interest From Map item in the Options menu. In BrainVoyager QX 1.4 or earlier, this menu item was not available. In these versions, the VOIs can be created from a VMP by clicking the Show Map In Glass Brain menu item in the Options menu. Besides creating the VOIs, this function also creates a surface representation of the thresholded statistical map. For the purpose of mask creation, however, you may simply close the appearing surface window with the glass brain visualization. You may also toggle the appearing Talairach VMR visualization back to the original VMR data set by pressing the F8 key.
Thresholding the VMP. Note that if you use a low threshold for the statistical test (i.e. a low t-value threshold) combined with a low or disabled cluster threshold, you may get hundreds of "spurious" VOIs. To avoid this result we suggest to use the FDR suggested single-voxel threshold combined with an enabled cluster threshold of 200 - 500 VMR voxels, which corresponds roughly to 7 - 18 voxels in the standard resolution (3x3x3) of the GLM/VTC space.
Example
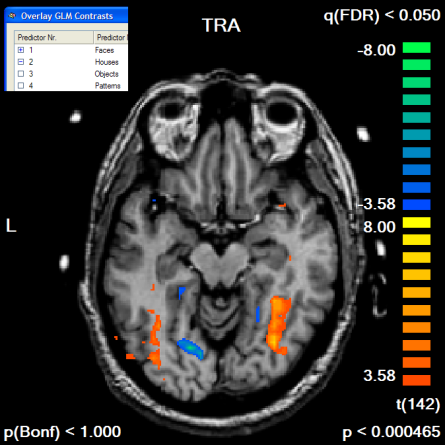
The following example illustrates the outlined procedure. The example starts with the "RM_TAL.vmr" data set to which the "RM_Localizer.vtc" has been linked (the data can be found in the "RFX ANCOVA" and "CbAlignment" data sets). A standard GLM has been run using the "RM_Localizer.rtc" file to define the design matrix. The functional data set contains "Houses" and "Faces" conditions as well as some others, which are ignored in this example. We want to apply the contrast "Faces > Houses" ("Faces [+], Houses [-]") with and without a mask file. The mask file itself will be created from the contrast "Faces [+], Houses [+]". Since we use the same data set for mask definition and subsequent statistical test, we must avoid circularity by using orthogonal contrasts. Contrasts are orthogonal if the sum of the element-wise multiplication of the contrast values results in zero, which is the case in our example ((+1*+1) + (+1*-1) = 0). The snapshot below shows an axial slice of the "Faces > Houses" contrast without usage of any mask file.
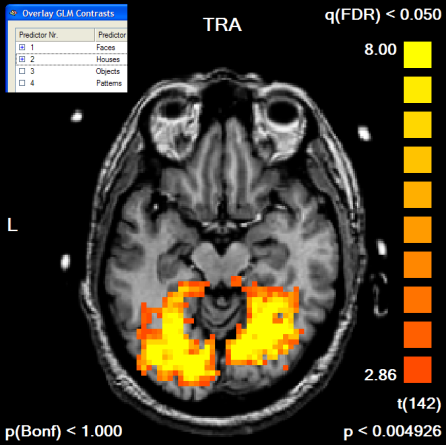
Next, we run the contrast "Faces [+], Houses [+]", which we will use to define our mask. To see the resulting map in the GLM resolution, we turn the Trilinear interpolation option off in the Overlay GLM Options dialog. The resulting map has been edited in the Volume Maps dialog to show only positive values and to show only clusters with an extend of 300 1mm voxels, which corresponds to a cluster size of 11 3x3x3 mm voxels. The default FDR threshold of q<0.05 has been kept. A slice of the resulting map is shown below.
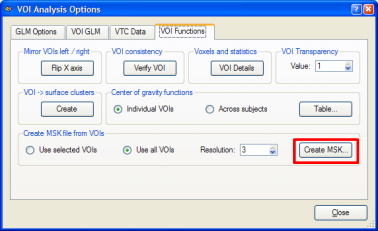
We now convert the obtained map into a mask. We can do this in one step by using the Options | Create VTC Mask From Map command or by using the indirect way via the VOI dialog. Here we first create the VOIs by clicking the Options | Create Volumes-Of-Interest From Map command (or the Options | Show Map in Glass Brain command). A set of VOIs will be defined, one for each non-connected cluster of the VMP. To convert the set of VOIs into a mask, the Create MSK button is clicked in the VOI Analysis Options dialog as shown below. The program asks for a name under which the mask will be saved (i.e. "Contrast_PlusHousesPlusFaces_Pos_Cl300.msk").
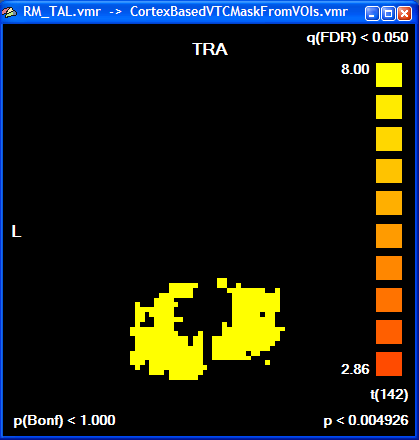
The created mask is shown as a secondary VMR - you can toggle between the mask and the primary VMR file by clicking the F8 key. To see the created mask without the overlayed statistical map, you can turn off the display of the VMP by unchecking the Overlay 3D map option in the VMP display option field of the 3D Volume Tools dialog. In recent versions of BrainVoyager QX, the statistical map is turned off automatically. You can check the Overlay 3D map option to re-enable showing of overlayed statistical maps. The following snapshot shows the same slice of the mask as shown above for the statistical map: all voxels included in the mask are color-coded as yellow. Any subsequent GLM using this mask will be restricted to the "yellow" voxels.
To finally see our initial "Faces > Houses" contrast in combination with the created mask, the GLM is run again this time using the saved mask file in the Single Study GLM Options dialog. Click the Browse button in the Mask-based (i.e. cortex-based) analysis field of the Masking functions tab; then the previously saved mask file (e.g. "Contrast_PlusHousesPlusFaces_Pos_Cl300.msk") is selected followed by clicking the OK button. In the Single Study General Linear Model dialog, the same design matrix file is loaded as before ("RM_Localizer.rtc"). Click GO to run the masked GLM. You will first see as usual a map with the overall contrast (all conditions set to [+]). To see the contrast we are interested in, open the Overlay GLM Contrasts dialog and enter the "Faces [+], Houses [-]" contrast. The resulting map should look like this:
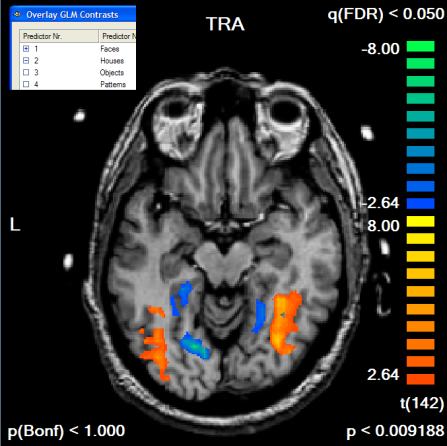
If we compare the obtained map with the one obtained without the mask, we clearly note that the map shows more significant voxels although the FDR threshold value has not been changed. The single voxel threshold has been "relaxed" to t > 2.64 (p < 0.009) as compared to the unmasked map with t > 3.58 (p < 0.000465). This result reflects the huge gain in statistical power which can be obtained by masked statistical analysis. You can inspect the number of voxels, which have been used for the correction of multiple comparisons, by looking at the Nr of voxels for correction text box in the Mask-based reduction of multiple comparisons field in the Overlay GLM Options dialog.
Copyright © 2014 Rainer Goebel. All rights reserved.