BrainVoyager QX v2.8
Probabilistic Maps
When performing fMRI group studies, it is very interesting to investigate the spatial consistency of activity patterns across subjects. One useful approach to quantify this consists in the calculation of probabilistic functional maps. At each spatial location, such maps represent the relative number of subjects leading to significant task activity. In a study of 20 subjects, for example, a value of 60% would mean that 12 subjects activated the respective brain region. It is evident that the calculation of probabilistic functional maps depends to some extent on the chosen brain normalization method since probabilities are determined by counting how many subjects do activate at the "same" spatial location. For volumetric normalization schemes, spatial coordinates (e.g. in Talairach or MNI template space) address homologue regions in the brains of different subjects. For cortex-based normalization schemes, aligned surface points (vertices) are used to address homologue brain regions. Relative to a good macro-anatomical alignment, probabilistic functional maps may reveal the spatial variability of functional brain areas across subjects.
In BrainVoyager QX, probabilistic maps can be calculated using volumetric maps (VMPs) or surface maps (SMPs); for each subject, the same type of information must be represented in the map; in the context of a GLM analysis, the same contrast must be calculated for each subject, which can be easily done as described in topic Creating Multi-Subject T and Beta Maps from Mult-Subject GLMs. Since volume or surface maps can also be created using several other tools (e.g. Independent Component Analysis, Granger Causality Analysis, Cortical Thickness Analysis), probabilistic maps provide a general means to evaluate the spatial consistency of effects across subjects. When subjects have been co-registered using cortex-based alignment, the surface maps of participating subjects must be transformed in group-aligned space prior to calculation of probabilistic maps. This step is not necessary when calculating GLM-based probabilistic surface maps since the cortex-based GLM performs the cortex-based alignment step implicitly, but it is necessary, e.g., for cortical thickness maps.
Probabilistic maps can be also calculated based on regions-of-interests (ROIs) specified for each subject in volume (VOIs) or surface (POIs) space. When ROIs have been specified on subject's cortex (SPH) meshes, the POIs must be transformed first into aligned space prior to calculation of probabilistic maps. If homologue VOIs or POIs have been defined for each subject, resulting probabilistic maps will be more focal and easier interpretable than probabilistic maps from volume or surface maps. On the other hand, probabilistic maps on the basis of subject's maps may help to reveal unpredicted consistent regions or extended networks across subjects.
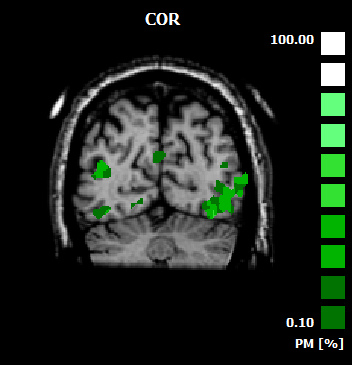
In order to properly represent probabilistic maps, the map type "PM" has been defined, which represents at each voxel or vertex a percent value in the range from 0 - 100. This map type is recognizable by the "PM" label in the displayed color bar as shown in the snapshot below. The threshold value can be changed as usual; if one wants, for example, to see only the locations in a probabilistic map where 50 or more percent of the subjects overlap, the Min threshold must be set accordingly in the Volume Maps or Surface Maps dialog. It is also possible to use the Increase Threshold and Decrease Threshold icons to modify the percent threshold. The information how many subjects were included in calculating a probabilistic map is provided in the DF 1 field of the Volume Maps and Surface Maps dialog (the degrees-of-freedom value is not used for any statistical calculation in case of a PM map). In order to see better transition zones in probabilistic maps, special look-up tables may be used; examples for a useful look-up-tables are provided in the "MapLUTs" folder (e.g. "ProbMap_Red.olt", "ProbMap_Green.olt", "ProbMap_Blue.olt"); each volume or surface map may have its own look-up-table (it is also possible to assign an individual color gradient for each map, which is interpolated between a specified "min" and "max" color).
The following sections describe in more detail how to:
- calculate probabilistic maps from multi-subject volume maps (VMPs)
- calculate probabilistic maps from multi-subject surface maps (SMPs)
- calculate probabilistic maps from volumes-of-interest (VOIs)
- calculate probabilistic maps from multi-subject surface maps (SMPs)
Copyright © 2014 Rainer Goebel. All rights reserved.