BrainVoyager QX v2.8
ROI Analysis of Cortical Thickness Maps
While group differences in cortical thickness measurements can be mapped at the vertex level, the statistical power of this approach is limited and requires many subjects to yield significant results, corrected for multiple comparisons. If a specific patient group, for, example would have a reduced cortical thickness in a larger anatomical structure, such as a sulcus or a lobe, it would be statistically much more powerful to compare averaged thickness values from these regions across subjects. Such a region-of-interest approach would substantially increase statistical power because all vertex thickness values of the macro-anatomical structure would be averaged in each subject. Furthermore, the multiple comparison problem would be reduced substantially (from number of vertices to number of considered ROIs). This region-of-interest approach requires the selection of arbitrary sub-regions of meshes, which is provided in BrainVoyager QX by the Patches-of-Interest (POIs) feature. To perform a region-of-interest cortical thickness analysis, switch to the POI Analysis tab of the Cortical Thickness Analysis dialog (see figure below). This tab contains a table, which will be filled with thickness measurements for each POI in each subject.
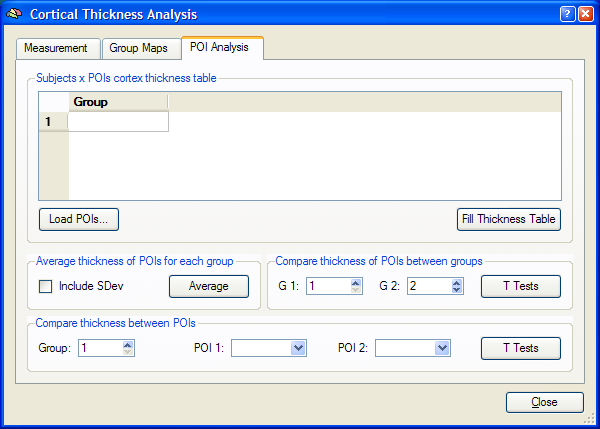
The POI thickness analysis tool requires that the list in the Groups field in the Group Maps tab has been filled appropriately as described in the previous section. In addition, a POI file must be loaded, which may contain any number of surface patches. You may use, for example, the POI files for lobes, gyri and sulci provided in the "AtlasBrains" folder, which should be located in the BrainVoyager QX folder after a regular installation. Before using these POIs, the target (group) brain must be aligned to the atlas brain using CBA. In this description, we use the simulated data as described in the previous section. Two POIs have been defined in this example, one for a patch in the left bank and one for the right bank of the sulcus. After having loaded the cortical thickness group list in the Group Maps tab, the POI file "SulcalBanks.poi" has been loaded using the Load POIs button in the Subject x POIs cortical thickness table field.
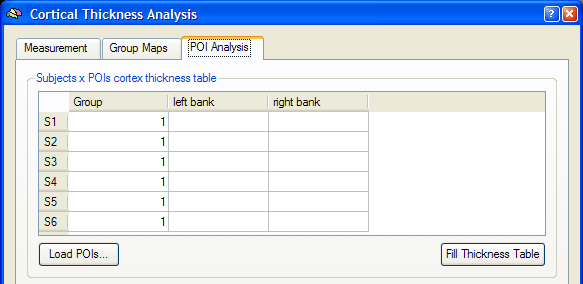
After having provided the necessary information, the subjects x POIs table shows the individual subjects in the vertical header (subjects S1 - S6) and the POIs in the horizontal header (POIs "left bank" and "right bank"). To fill the table with thickness values averaged over all vertices of each POI for each subject, click the Fill Thickness Table button. After calculating the 12 (6 subjects x 2 POIs) cortical thickness values for the example data, the table is filled with the values shown below.
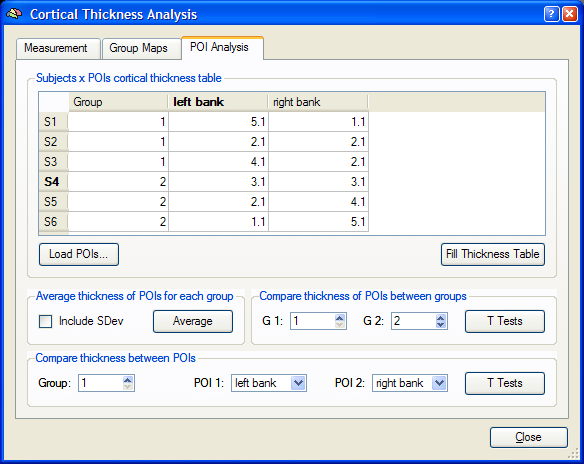
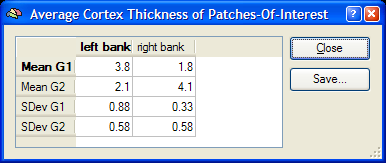
The completed subjects x POI table forms the basis for subsequent statistical POI group comparisons (see below). It is furthermore possible to calculate average group thickness values for each POI. This function is similar as the function to calculate average group thickness maps available in the Group Maps tab. While this kind of averaging operates on each vertex, the group averaging function in the Average thickness of POIs for each group field operates on Patches-Of-Interest. To calculate a table with the averaged thickness values per group and POI, click the Average button in this field. You may turn on the Include SDev option, which will calculate the standard deviation of the POI thickness values across the subjects of the respective group. The results of these computations are presented in the Average Cortical Thickness of Patches-Of-Interest window, which is shown below for the example data.
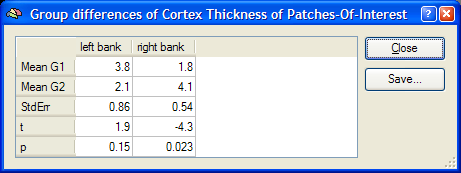
Besides calculating descriptive group thickness data for regions-of-interest, two statistical tests can be performed in order to assess group differences in cortical thickness. The first test allows to compare whether the thickness within a POI differs between groups. This is similar to the t test calculated at the vertex level in the previous section (Group Maps tab) but works on the values calculated for each POI as shown in the subjects x POI table. To calculate a t test between two groups for each available POI, click the T Tests button in the Compare thickness of POIs between groups field. The results of the t tests are presented in the Group differences of Cortical Thickness of Patches-Of-Interest window, which is shown below for the example data. In the example data, the difference in cortical thickness for the POI "right bank" is significant (p < 0.05), while the difference in cortical thickness for the POI "left bank" is not significant.
An interesting question might be to compare the thickness in different POIs within the same group of subjects. The t test available in the Compare thickness between POIs field allows to test this type of question. Select a group in the Group spin box. Then select one of the two patches-of-interests in the POI 1 box and the other one in the POI 2 box. To test whether the mean cortical thickness differ in the two selected POIs, click the T Test button in the Compare thickness between POIs field.
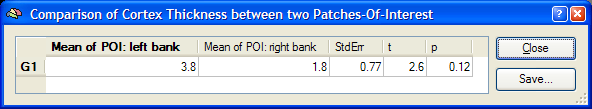
The results of the t test are presented in the Comparison of Cortical Thickness between two Patches-Of-Interest window, which is shown above for the example data. In the example data, the cortical thickness between the POIs "right bank" and "left bank" do not differ significantly in group 1 (p = 0.12).
Copyright © 2014 Rainer Goebel. All rights reserved.