BrainVoyager QX v2.8
Diffusion Tensor Visualization
After linking a DDT file to a VMR file, various diffusion maps can be calculated including color direction maps. A more explicit visualization of the orientation of the maximum eigenvector can be performed in the surface module: The orientation of the maximum eigenvector is visualized as a line at the position of the corresponding voxel in 3D space.
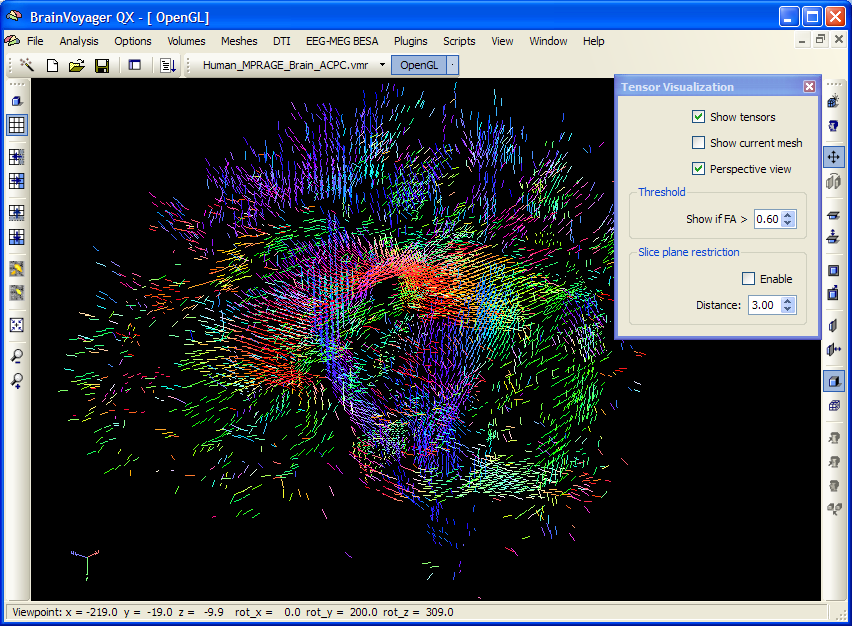
To allow tensor visualization in the surface module, select the Tensor Visualization item in the DTI menu after linking a spatiall matching DDT file to an opened VMR file. This will automatically open a surface window (if not already opened for the current VMR document) and also invokes the Tensor Visualization dialog (see snapshot above). The dialog will be shown on the right upper corner of the document's surface window. The surface window shows the maximum eigenvector orientations as short color-coded lines. As with Color Direction maps, the color red is used to indicate diffusion along the left/right axis (eigenvector [±1, 0, 0] ), the color green is used for diffusion along the anterior/posterior axis (eigenvector [0, ±1, 0] ) and the color blue is used for diffusion along the inferior/superior axis (eigenvector [0, 0, ±1] ). Diffusion along intermediate orientations is visualized by mixing of the three basic colors according to the magnitude of each orientation component.
The Tensor Visualization dialog allows to change relevant tensor display parameters. To show or hide the maximum eigenvector lines, check or uncheck the Show tensors option. As a convenience, some options are available, which can also be changed at other places. In case that a mesh has been loaded, it can be shown or hidden with the Show current mesh toggle. The viewing mode can be switched between orthographic and perspective viewing with the Perspective view toggle. A especially useful option is the possibility to specify a fractional anisotropy (FA) threshold value using the Show if FA > spin box: The orientation line for the eigenvector with the largest eigenvalue is only shown if the FA value of the respective voxel surpasses the specified threshold.
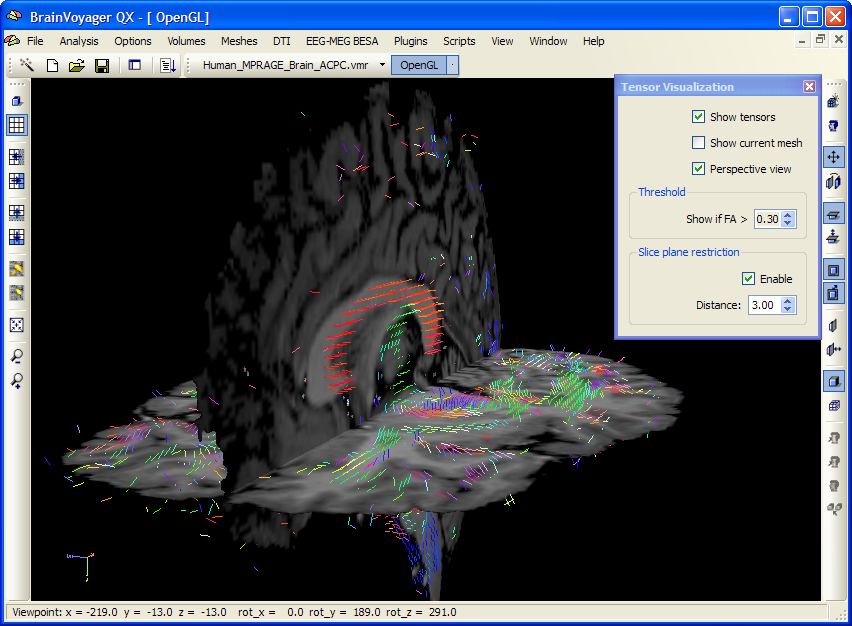
Despite thresholding, displaying orientation lines at all supra-threshold voxels may present still a overwhelming visualization. To reduce the display of tensor lines further, an option can be enabled in the Slice plane restriction field to restrict the display of eigenvectors to a small distance (specified in the Distance spin box) with respect to visualized slice planes (see snapshot above). This option is especially revealing when the slice plane is slowly moved through the data allowing to track diffusion tensors along the dimension orthogonal to the slice plane.
Copyright © 2014 Rainer Goebel. All rights reserved.