BrainVoyager QX v2.8
What's New
The following section briefly summarize the major new features of the current release as well as major features introduced in previous releases. For a complete list of new features, enhancements and bug fixes, please consult the release notes. Use the provided links to quickly move to the corresponding documentation in the User's Guide.
BrainVoyager QX 2.8
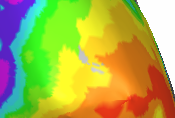
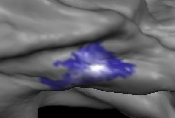
Population Receptive Field (pRF) Estimation
As a modern alternative to phase-encoded retinotopic mapping, it is now possible to estimate population receptive fields and to derive eccentricity and polar angle maps at the voxel (VMR-VTC data) or vertex (SRF-MTC data) level. While pRF estimation is more compute intense than conventional retinotopic mapping, the model-driven approach provides better mapping results and more neuronal population information including estimates of receptive field size.
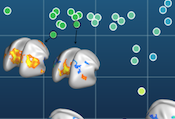
Multi-Dimensional Similarity Scaling (MDSS)
The new MDSS plugin projects fMRI spatial patterns (e.g. from GLM contrast maps, ICA components or MVPA trials) as points on a 2-dimensional space visualizing the (dis)similarities between pairs of objects as distances between these points. The interactive visual tool provides many new possibilities, e.g. to find outliers or to explore whether maps from different subjects form a single cluster or multiple clusters. For details, consult the documentation provided by the plugins, i.e. select the MDSS Plot Plugin Online Help link in the short description that appears for plugins when selecting the Plugins -> Description Of Plugins menu
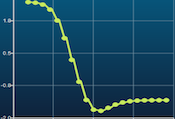
Multiple Linear Regression
The new multivariate linear regression (MLR) tool extends MVPA allowing to relate changes of distributed patterns over time with one or more continuos variables spanning a continous range of values (e. g. ratings). While MVPA allows predicting unseen labels (classification) after learning, MLR predicts changes of a variable (regression) from a new data set. For details, consult the documentation provided by the plugins, i.e. select the MLR Plugin Online Help link in the short description that appears for plugins when selecting the Plugins -> Description Of Plugins menu.
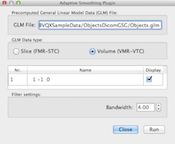
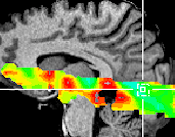
Adaptive Smoothing
The new adaptive smoothing plugin provides an advanced approach to smooth statistical t maps without reducing effective resolution. Conventional non-adaptive smoothing, on the other hand, reduces the effective spatial resolution limiting the benefit of higher resolution during image acquisition. This property makes adaptive smoothing especially interesting for high-resolution fMRI data. The tool has been implemented as a plugin by the original authors of the method. For details, consult the provided documentation, i.e. select the Adaptive Smoothing Plugin Online Help link in the short description that appears for plugins when selecting the Plugins -> Description Of Plugins menu.
Other new features include improved advanced segmentation that is also integrated in the automatic segmentation pipeline, resolution-independent ACPC and Talairach space, improved plotting functionality for developers (used e.g. in the MDSS plugins) and new scripting possibilities based on new "MeshScene" and "Mesh" scripting objects that allow to perform mesh morphing, MTC preprocessing and statistics as well as (rigid) CBA (see Developer's Guide for details).
Version 2.8.2. Besides bug fixes, the maintenance release v2.8.2 added the possibility to create VMP files from SMP files (e.g. to project surface curvature maps into volume space), to create POIs from VOIs, to merge corresponding POIs from 2 meshes (e.g. for integrating corresponding POIs from left and right hemisphere), VOI-based high-resolution grid sampling, creation of VTCs with data identical to the source FMR data, application of motion parameters from an external file and improvements of diffusion weighted data analysis.
Version 2.8.4. Besides bug fixes, the maintenance release v2.8.4 added new tools and enhancements, including a new plugin for opposite phase encoding (AP-PA or LR-RL) based EPI distortion correction, the possibility to segregate voxels in different depth bins in the context of the cortical depth sampling tool, new scripting command for VOI handling and VOI-GLM processing, across-time VTC averaging, VOI-based masking of VMPs, POI-based masking of SMPs and better V16 auto-transformation support.
For a complete list of new features and bug fixes, inspect the release notes that can be inspected by selecting the Show Release Notes item in the Help menu.
BrainVoyager QX 2.6
High-Resolution CBA and Functionally-Informed CBA
While cortex-based alignment (CBA) achieves high corresondance of macro-anatomical landmarks (sulci, gyri) across subjects, functional areas still exhibit residual variability. In order to further increase functional alignment for whole-cortex group statistics, it is now possible to use functionally defined regions as additional targets during CBA. Furthermore, CBA now also supports alignment of high-resolution meshes.
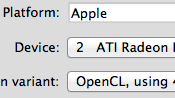
High-Speed GPU-Based Sinc Interpolation
This is the first release that offers the option to run compute-intense algorithms directly on the graphics board substantially reducing calculation time. The most important function now running on the graphics processing unit (GPU) is the - usually slow - sinc interpolation that is used to produce high-quality spatial transformations in many compute-intensive spatial transformation routines such as volume (map) transformations and 3D motion correction.
Aterial Spin Labeling (ASL) Data Analysis
The new slice-based and volume-based ASL plugins generate perfusion-weighted time-course data and absolute (quantitative) cerebral blood flow (CBF) maps for single- and multi-subject analyses. Absolute CBF quantification is especially useful for (patient) group studies. For details, consult the documentation provided by the plugins, i.e. select the ASL Plugin Online Help link in the short description that appears for the plugins after selecting the Plugins -> Description Of Plugins menu.
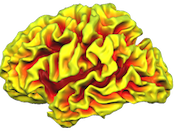
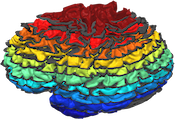
Sulcal Depth Maps
Sulcal depth maps can now be created that provide information about the depth of voxels or vertices within sulci. The created maps can be used for scientifically interesting macro-anatomical studies, e.g. to compare how the depth of specific sulci differs across patient or age groups. Sulcal depth surface maps may also be used for surface visualization of folded, inflated and flattened cortex meshes as an alternative to the standard curvature maps.
Other new features include SVM and MANOVA searchlight mapping , ROI-SVM batch processing and a realistic EEG head model. For a complete list of new features and bug fixes, inspect the release notes that can be called from the Help menu.
BrainVoyager QX 2.4
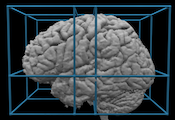
Automatic Talairach Transformation
In previous versions, the normalization of 3D anatomical VMR data sets into AC-PC and Talairach space required manual determination of the AC and PC landmarks, the specification of angles to orient the brain with the mid-sagittal plane (MSP) and finally the determination of the borders of the cerebrum. AC-PC and Talairach transformation can now be performed automatically for most VMR data sets.
Mesh-Based Cortical Depth Sampling
This version introduces high-resolution sampling of funcional data within grey matter (GM) at arbitrary relative depth levels. This is an important feature when analyzing functional data with very high spatial resolution in the sub-millimeter range as becomes available with ultra-high field scanners (7 Tesla and beyond). The whole-mesh cortical depth sampling tool creates a series of meshes at different relative depth levels. These created meshes are then used to sample the functional data at the respective depth values
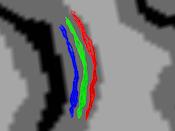
Grid-Based Cortical Depth Sampling
The high-resolution grid sampling tool supports even more precise sampling of very high-resolution functional data from small folded cortical regions. This tool enables data sampling on implicitly created regularly spaced two-dimensional grids providing precise detailed topographically mapped information at any desired arbitrary relative depth level.
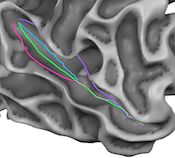
Calculation and Visualization of Shortest Paths
The shortest path tool creates and visualizes shortest paths between two vertices on folded meshes. It also measures the distance between the first and last vertex of a path. While not mathematically the shortest path (geodesic), the tool also creates paths on request that follow iso-lines in loaded surface maps. Such "shortest paths" are very useful for more quickly labeling landmarks such as the ridge of a gyrus or the fundus of a sulcus.
Copyright © 2014 Rainer Goebel. All rights reserved.