BrainVoyager QX v2.8
Verification of Segmentation Results
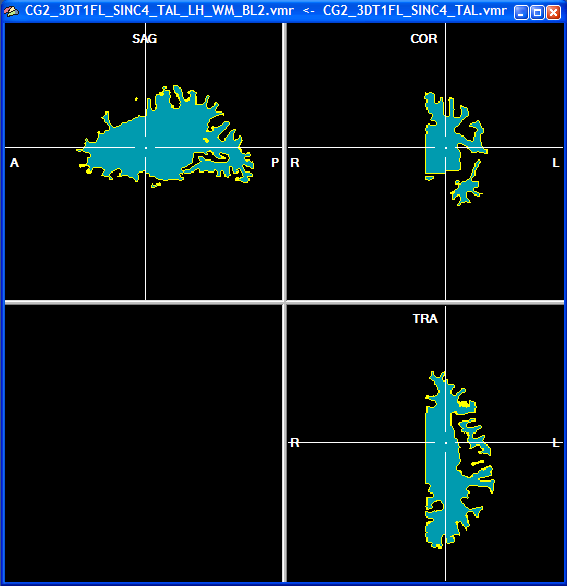
Although the automatic segmentation tools work robustly in most cases, it is important to evaluate the obtained segmentation quality. It is often also necessary to improve the segmentation by manual editing in a few regions including medial regions around amygdala and hippocampus, ventricles and medial occipital lobe. There are several tools which allow to inspect the segmentation result. The most important one is the superposition tool allowing to visualize the VMR containing the white matter segmentation together with the VMR containing the original (or any other) intensity data (image fusion). To use this tool, open first the segmented VMR of one hemisphere, i.e. "[name]_TAL_LH_WM_BL2.vmr". To load the second VMR, click the Load Secondary VMR item in the File menu. The original intensity data is now loaded as a second VMR. In the title bar of BrainVoyager QX (in maximized document window mode) or on the title bar of the VMR window (in detached document window mode), you will now see the file names of both lodaded VMR data sets as shown in the figures below. The two names are also shown on the workspace tool bar. An arrow between the two file names indicates what is currently shown in the VMR viewing window. Initially, the arrow points to the left side indicating that the VMR loaded first, the segmented data set, is shown (see figure below).
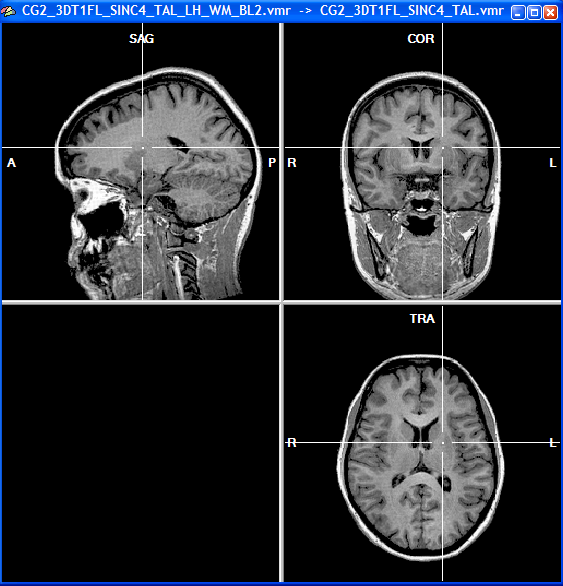
If you click the 'F8' button, the arrow will point to the right side indicating that now the second VMR loaded, the original intensity data, is shown (see below). Repeatedly pressing the 'F8' key will toggle back and forth between the two loaded data sets.
The superposition tool is activated when you click the F9 key. Now the arrow will point both to the left and right side indicating that now both data sets are visible in a fused mode (see figure below). The fused visualization is computed by rendering all black voxels of the first data set transparent. If you now click the F8 toggle, it will switch between the first loaded data set and this superimposed view.
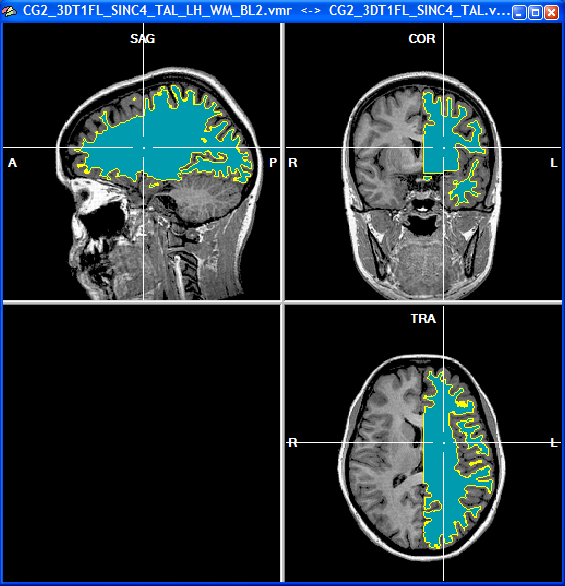
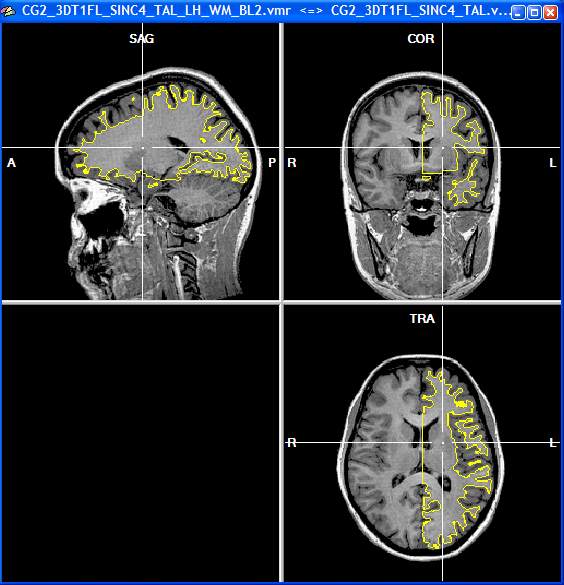
This "merged" or "fused" view of the segmented and original data set is very helpful to evaluate the quality of the segmentation. You should find grey matter surrounding the yellow line if the segmentation is correct. You can navigate within the data as usual allowing to inspect any region. A second type of image superposition can be invoked by clicking once more the F9 key. The arrow in the title bar between the two file names will again point to both sides but will have now two horizontal lines. In this mode, only the boundary of the first file is shown, any other voxel is made transparent. This visualization option is very helpful because it allows to see the intensity values on both sides of the segmented cortical sheet (see figure below). On one side of the yellow line you should see only grey matter voxels whereas on the other side you should see only white matter voxels.
An alternative method to check the quality of the segmentation is by projecting a mesh surface into the VMR space. In the figure below the "_WM.srf" polygon mesh has been projected into the original intensity data. To project a mesh in a VMR, load first the VMR file and then the SRF file in the surface rendering window. Then click the Spatial Transformations item in the Meshes menu. In the appearing Mesh Transformation Options dialog, click the Mesh -> VMR button. Note, that the projected yellow line is directly painted into the VMR data set. To undo this step, click the Reload All button in the Segmentation tab of the 3D Volume Tools dialog.
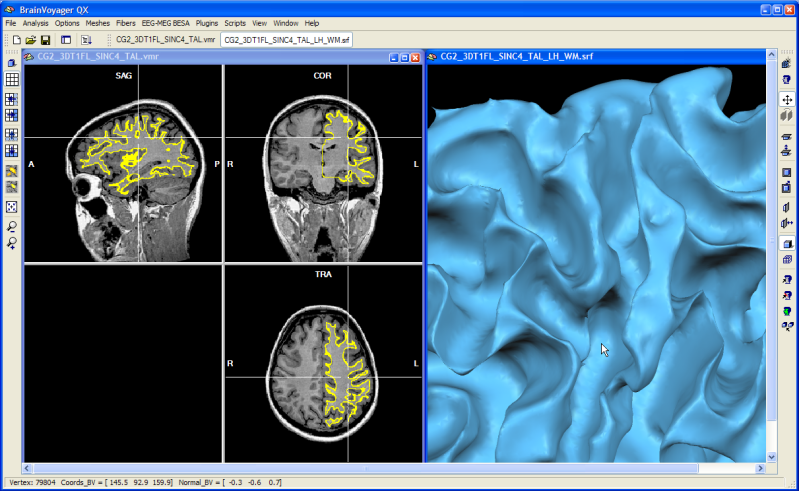
Note: You may use the Tile option in the Window menu to arrange the VMR and surface window side by side as shown in the figure above. If you Ctrl-click a point on the mesh representation, you will then immediately see the corresponding position in the VMR data. In the snapshot above, a position in the central sulcus has been Ctrl-clicked in the surface window (right side), which is immediately followed by positioning the white cross to the corresponding voxel in the VMR data set (left side).
Note: The mesh projection method is useful for quality assurance but the dual VMR method described above is better suited in most cases to check the validity of cortex segmentation since it allows at the same time to visualize and to edit the segmentation result.
Copyright © 2014 Rainer Goebel. All rights reserved.